Wednesday 30 October 2013

Saturn Science in 2013

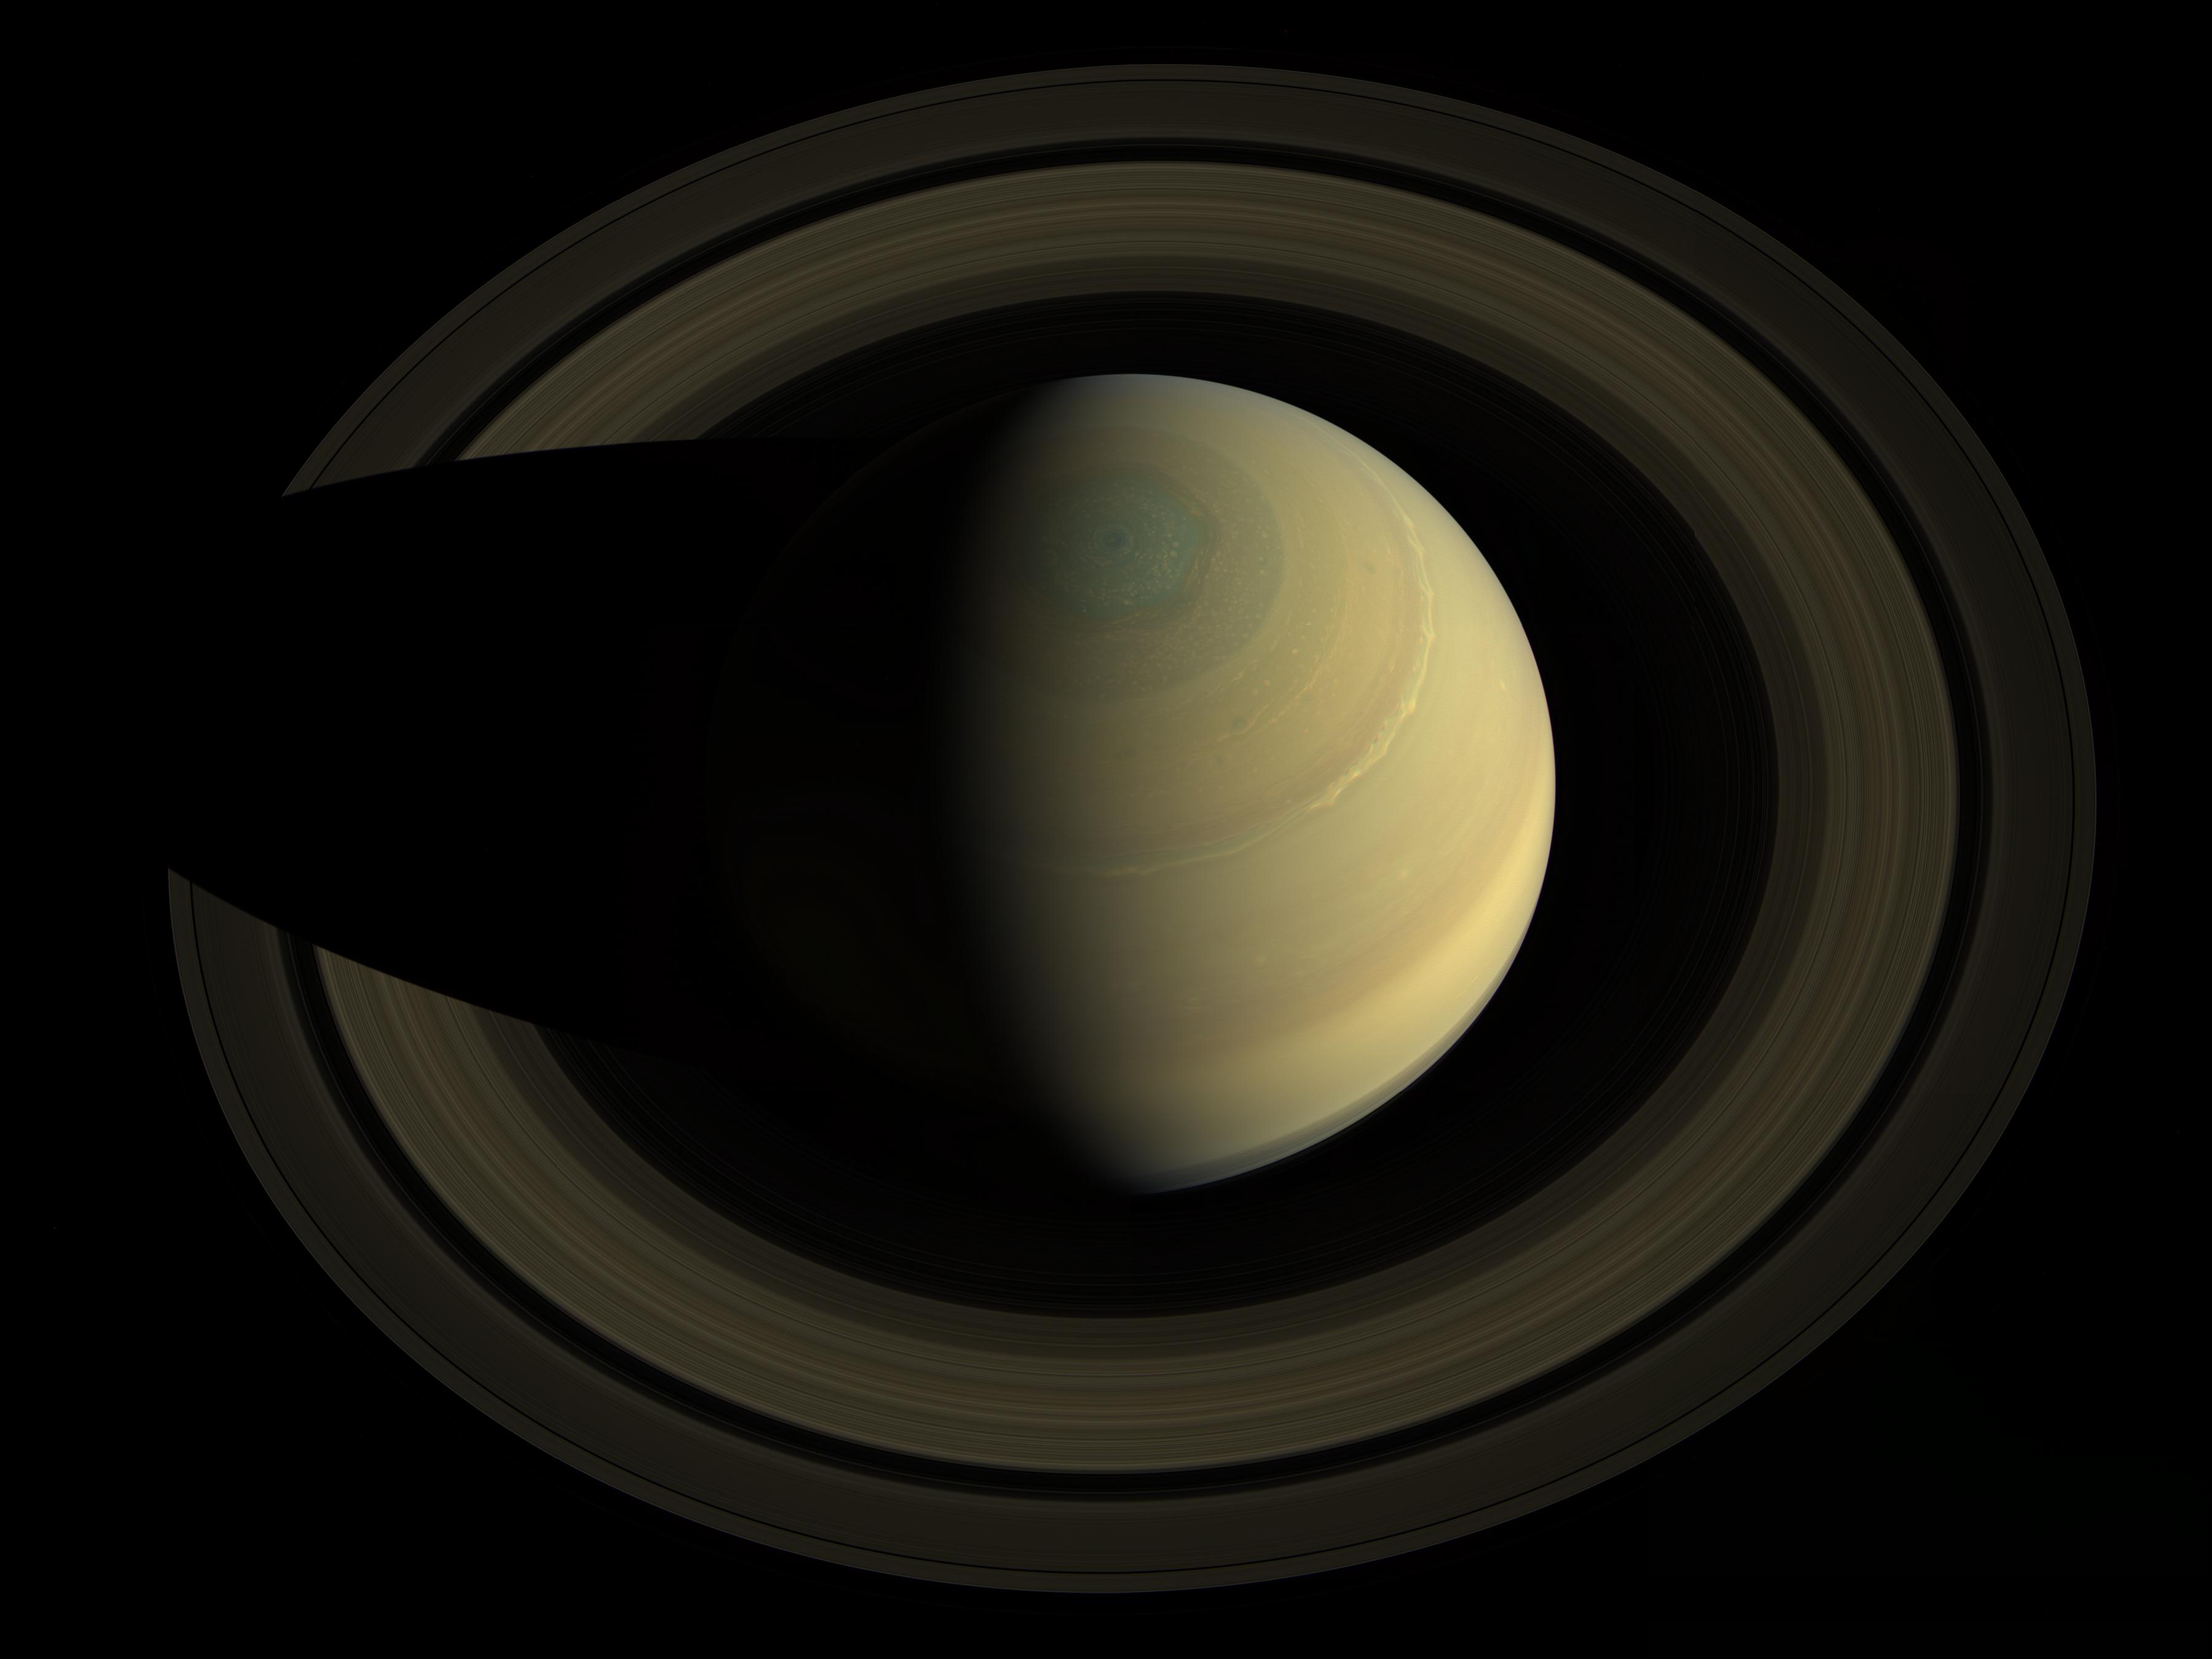
Completing a trio of posts on the state of giant planet science in 2013, based on notes, tweets and abstracts submitted to two large conferences, EPSC in London and the DPS in Denver.  Late 2013 finds Saturn's northern springtime hemisphere (four years after the equinox, and four years until summer solstice) continuing to recover from the major 2010-11 storm, with the continued presence of the stratospheric 'beacon' (see 'Saturn's Stratospheric Vortex') and tropospheric anticyclone (see 'Saturn's Storm Vortex Survives!') spawned by the storm, and observations of the north polar hexagon and polar cyclone as they come into view from Earth (see 'Saturn's Hexagon Viewed from the Ground').

Cassini Returns to Saturn's Poles
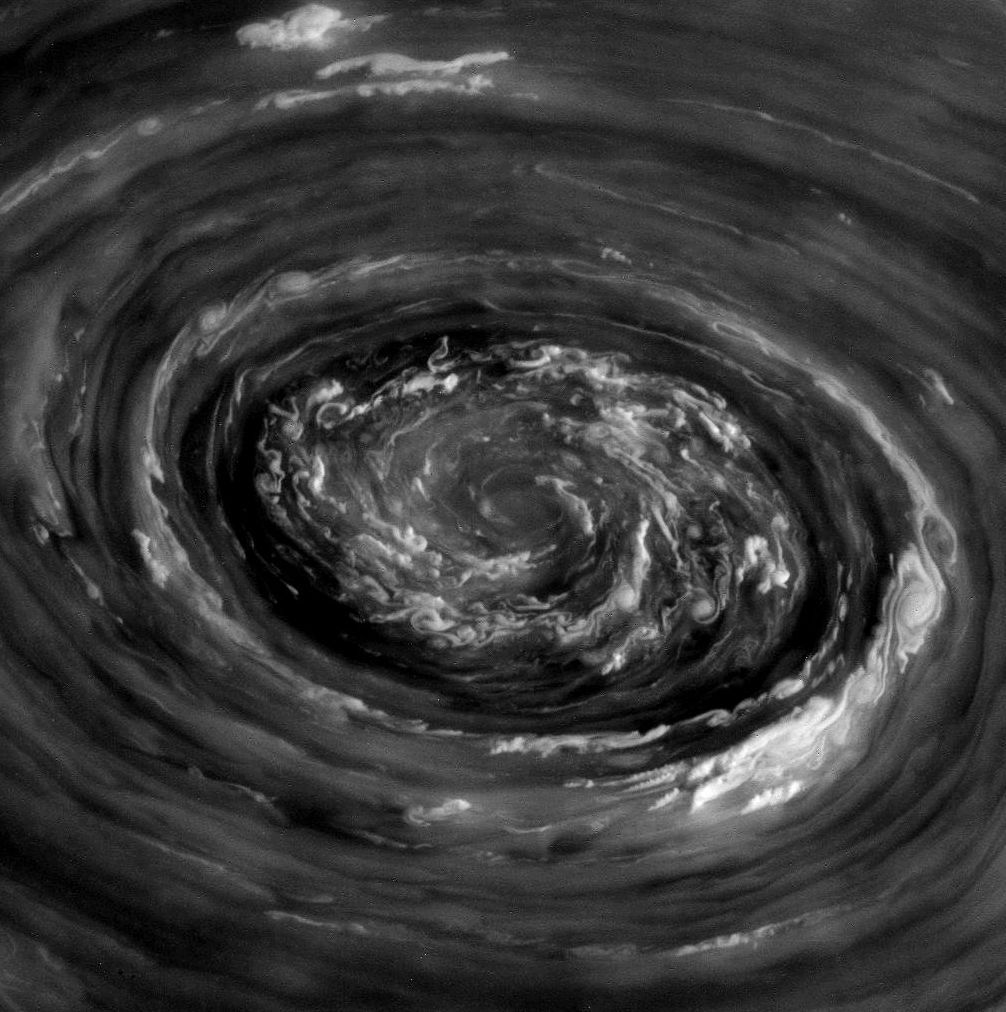
Cassini ISS stares down into the heart of Saturn's north polar
cyclonic vortex.

My own research (presented at EPSC) concerned new observations of Saturn's poles by Cassini, now that the spacecraft has returned to an inclined orbit around the gas giant.  I used thermal spectroscopy from Cassini/CIRS to show the continued presence of hot spots at both poles of Saturn, which correspond to cyclonic vortices at both poles irrespective of season.  We also showed the cooling of the south polar 'autumn' stratosphere and hints of a warming north polar stratospheric vortex, as atmospheric temperatures, composition and clouds change in response to the increasing sunlight in the northern hemisphere.  Saturn's south pole is now in the darkness of approaching winter, and Momary et al. (DPS) show that the hot cyclone still corresponds to a hurricane-like vortex with a cloudless 'eye' lying deeper than the surrounding cloud decks.  

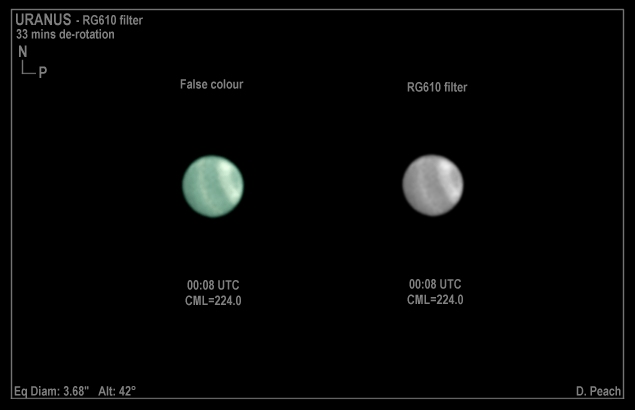
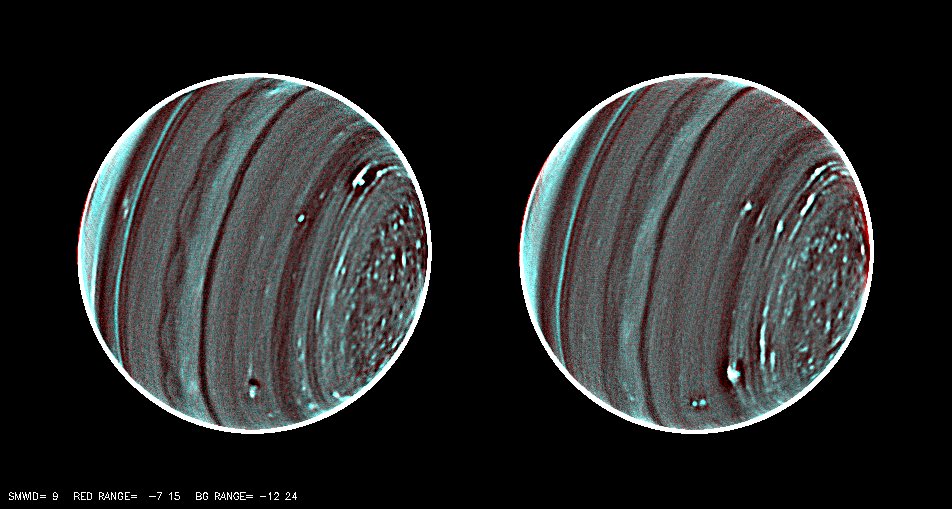
The north polar hexagon is now readily visible in spring sunlight, with new results from Cassini/VIMS (Momary et al., DPS), Cassini/ISS (Sayanagi et al., DPS) and ground-based observations (Sanchez-Lavega et al. EPSC) suggesting that the hexagon is slowly rotating westward in longitude, rather than being stationary as we previously thought.  On the other hand, ground-based amateur observations presented by Delcroix et al., (EPSC) were able to resolve the hexagon vertices throughout 2013, but were not accurate enough to see any slow drifts.  Sanchez-Lavega et al. suggest that the hexagon has the most stable rotational period of any feature on Saturn, making it an excellent candidate for constraining the deep internal rotation rate of the planet.  Finally, Momary et al. showed discrete clouds racing around the edges of the hexagon, and a massive storm residing just poleward of the hexagon system, which seems to have become increasingly cloudy since 2008 and could be a 'shepherding storm' for the hexagon.

Saturn's northern hemisphere as seen from above
on October 10th 2013.
Seasonal Saturn

Scientists studying Saturn are interested in far more than the polar latitudes, and Cassini continues to provide a unique opportunity to study the seasonal evolution of a gas giant.  Sinclair et al. (EPSC) and Li et al. (DPS) find intriguing differences in Saturn's temperatures, winds and composition between 2009/10 from Cassini and 1980/81 from Voyager, exactly one Saturnian year earlier.  Edgington et al. (DPS) showed that Saturn's moving ring-shadow influences photochemistry and haze content during a year; Guerlet et al. (EPSC) and Sylvestre et al. (EPSC) used limb spectroscopy from Cassini to look at Saturn's evolving stratosphere, which will nicely feed into the new global climate model being developed by Spiga et al. (EPSC) for Saturn's middle atmosphere.  Orton et al. (DPS) focussed on a type of wave activity, namely slowly moving thermal waves observed on Saturn by Cassini and ground-based infrared observations since 2003.  These are very large-scale waves, and the strongest wave activity was discovered between 30-45S and 0-30N during southern autumn, with a strong correlation between tropospheric and stratospheric wave activity. They also found that that Saturn's waves occurred in trains over a limited longitude range but with little apparent correlation with known atmospheric storms (one possible cause of the waves), and with peak activity just before Saturn's northern spring equinox in 2009.

Over a duet of talks, Barth and Rages (DPS) describe Cassini observations of Saturn's limb at high phase angles and spatial resolutions of around 10 km, showing the presence and structure of particulates in Saturn's stratosphere.  The hazes are likely a mix of material, including solid organics formed as a result of methane photolysis and electron deposition, as well as water condensation and hydrocarbon ices (e.g., butane, diacetylene).  At even higher altitudes, Koskinen et al. (DPS) use Cassini/UVIS solar and stellar occultations to probe the temperatures of the thermosphere, finding exospheric temperatures (an exobase 2700-3000 km above Saturn's 1-bar level) ranging from 370-540 K and increasing from equator to pole by 100-150 K, consistent with auroral heating being redistributed to lower latitudes by some as-yet uncertain circulation.
  
Aftermath of the Great Storm

Finally, researchers are still using the wealth of Cassini and ground-based data from the springtime storm of 2010-11 to understand the processes governing Saturn's meteorology.  Sromovsky et al. (DPS) summarise their recent Icarus paper on Cassini/VIMS reflected sunlight imaging of the storm system, finding an aerosol population of ammonia and water ice, with some ammonium hydrosulphide as a third component.  This is the first identification of water ice on Saturn, required to improve the spectral fits around the 3-µm ammonia ice features, and supports the idea that the storm was powered by strong convection from the 10-20 bar depths of the water cloud.  Fouchet et al. (EPSC, DPS) followed up on our Cassini study of Saturn's stratospheric vortex (the beacon), using the TEXES instrument on the IRTF in July 2011 to determine the vertical structure of temperatures near the vortex, probing higher altitudes than Cassini could sense.  Finally, Li et al. (DPS) suggested that the 20-30 year periodicity of these enormous storms is caused by a prohibition of strong convection when the troposphere is warm, and the presence of water makes the column 'heavy'.  As the troposphere cools below some critical point, convection can begin and produce a warm column that overshoots into the stratosphere.  The resulting large-scale atmospheric adjustment causes ammonia vapour to condense and precipitate out as snow, causing the high brightnesses observed by the Cassini/RADAR teams at microwave wavelengths (indicating a depletion of ammonia).  However, it remains unclear why these eruptions should occur only at certain latitudes, but it certainly sounds like progress.

Finally, my own use of the IRTF/TEXES instrument back in February 2013 yielded the first results on the origins of nitrogen on both Jupiter and Saturn, in my second presentation at EPSC.  Although it's still a work in progress, the initial results seem to suggest that Saturn's primordial nitrogen came from the same place as Jupiter's..... so watch this space as I get the article written!

Key 2013 Saturn Papers


Monday 28 October 2013

Jupiter Science in 2013

Continuing the theme of my previous post on ice giant science in 2013, this time I'll take a look at the latest Jupiter studies presented at the European Planetary Science Congress (EPSC, September) in London and the Division of Planetary Sciences Meeting (DPS, October) in Denver.  I've cobbled these results together from tweets, abstracts, papers and conversations with colleagues, and any mistakes or omissions are my own!  And my apologies if your favourite result isn't here, I never meant to be totally comprehensive...

Damian Peach's image of a double shadow transit of Io
and Europa, October 5th 2013.
2013 found Jupiter in a more 'normal' state than in 2012, with the planet in the late stages of a 'global upheaval' in its banded structure, characterised by the episodic fading (whitening) of the typically red-brown belts, followed weeks or months later by dramatic storm-like revivals of their intense colours.  The current life cycle started with the fade and revival cycle of the South Equatorial Belt (SEB) between 2009 and 2011 (the chaotic rifting activity northwest of the Great Red Spot is now present and active), and most recently we've seen a revival of the North Equatorial and Temperate Belts (NEB and NTB) in 2012.   Amateurs are tracking a strange light patch to the east of the Great Red Spot, possibly a cyclonic oval within the SEB.  As usual, head to the Jupiter Section of the British Astronomical Society for apparition reports and more details.

The Colourful Clouds of Jupiter

The episodic changes in Jupiter's global appearance offer a unique glimpse into the processes responsible for generating the cloud colours and albedo patterns, both for entire red-brown belts and also for discrete red features.  The chromophore responsible for the Great Red Spot's distinctive colour remains a mystery because of difficulties in identifying unique signatures of any particular chemical, but several authors are making headway.  Simon-Miller et al. (DPS) presented Hubble Space Telescope images of an intense red cyclone visible in 1994-95, suggesting that the Great Red Spot, intense red ovals and North Equatorial Belt might indicate the presence of the same chromophore but under different conditions (e.g., different amounts of mixing with white clouds, or longer UV irradiation at high altitudes), with multiple components involving NH4SH (one of Jupiter's condensate clouds) and hydrocarbons (produced photochemically above Jupiter's clouds and then sedimenting downward) required to reproduce the spectra. Chanover et al. (DPS) presented work in a similar vein, exploring 300-1000 nm spectra of Jupiter acquired from Apache Point Observatory, whereas Bjoraker et al. (DPS) presented high-resolution 5-µm spectra of CH3D lines to probe structural differences between cloud-free 'hot spots' and cloudy vortices like the Great Red Spot, indicating that a water cloud near 5 bar is responsible for the main opacity of the Great Red Spot at 5 µm, and not the ammonia (0.7 bar) or NH4SH (2-3 bar) clouds we might have otherwise expected.  Conversely, their hot spot observations were consistent with a complete absence of the water cloud.

Giles et al. (EPSC) focussed on the processes responsible for the revival of Jupiter's reddish SEB colours, using 7-25 µm imaging of Jupiter's thermal emission from the VLT to determine the deep warming taking place during the revival and subsequent sublimation of the white 'faded' aerosols.  Furthermore, Tejfel et al. (DPS) used visible-light spectroscopy to show the higher density of scattering aerosols when the SEB was faded, likely due to enhanced ammonia ice condensation as the SEB cooled during the fade.  Pulling this infrared thermal emission (the long-wave) together with the changes in visible albedo (the short wave) will be a crucial element for understanding the cloud decks of Jupiter and the origins of the colours, but there's still a long way to go.

Making Waves

For atmospheric changes on Jupiter over even shorter timescales, Hueso et al. (EPSC) presented estimates of the impact flux into Jupiter's atmosphere based on the three recent bolide events (i.e., impact flashes) seen between 2010 and 2012.  These impactors were in the 5-20m diameter category and released similar amounts of energy to the Chelyabinsk meteor earlier this year.  Hueso et al. estimate 18-160 impacts of this nature per year on Jupiter.  Pond et al. (DPS) used numerical models of jovian impacts (the ephemeral flashes and observations of Shoemaker Levy 9 and the 2009 'Wesley' impactor) to study the propagation of shock waves through the atmosphere.

Impact flashes on Jupiter.
Rogers et al. (EPSC) report on the possible influence of a planetary-scale wave on Jupiter's south temperate belt (STB, bounded by jets at 26-29S and 36S and home to Oval BA), where there are always 2-3 structure sectors of small-scale turbulence, one of them headed by Oval BA at its eastern end.  Oval BA is typically followed by a dark segment that sometimes contracts to form a cyclonic oval (a dark barge).  From Rogers:  "The other structured segments begin as  small dark spots or streaks remote from oval BA, then expand, and eventually catch up and merge with  the dark segment at BA, inducing intense disturbance in and around it. This cycle has been completed three times in 15 years, maintaining at least 2 structured sectors at all times. The major changes in drift rate of oval BA appear to be due to the impacts and subsequent shrinkage of the structured segments." Interestingly, Rogers predicts that Oval BA will shrink in the coming years so that it no longer controls the dynamics of the STB, so the STB cyclonic segments will develop a long-lived pattern, with the spaces between developing into anticyclonic circulations that may herald the next generation of larger, anticyclonic white vortices (i.e., the state of the STB before 2000).

Comparing the Giant Jets

Liu et al. (DPS) presented numerical models seeking to explain why Jupiter has narrower and weaker atmospheric jets than Saturn's broad and strong jets.  Although the radii, rotation rates and atmospheres of the two worlds are rather similar, Jupiter has 15-20 off-equatorial jets with speeds of around 20 m/s at the cloud tops, whereas Saturn has only 5-10 wider off-equatorial jets, with speeds of around 100 m/s.  Both planets have strong super-rotating equatorial jets, and vortices fill the spaces between the jets.  Liu suggests that Jupiter's jets experience stronger magnetohydrodynamic drag in the planetary interior than on Saturn.  Heavens et al. (DPS) looked at why Jupiter's jet structure disappears poleward of 65 degrees (and vortices come to dominate the flow, referred to as 'polar turbulence'), whereas on Saturn the organised jet-like structure extends all the way to the pole.  They suggest that the stability of the jets is the main criterion for the transition to polar turbulence rather than jet-dominated flow.

A Selection of 2013 Jupiter Papers


Wednesday 23 October 2013

Ice Giant Science in 2013

September and October saw three major planetary science conferences taking place - the European Planetary Science Congress (EPSC) at UCL in London; the Division for Planetary Sciences (DPS) meeting in Denver, Colorado; and a Uranus after Voyager conference in Paris.  Sadly I couldn't make it to the latter two, but the increasingly large number of 'space tweeps' meant I could follow along in a virtual sense via Twitter, even asking the odd question from afar when necessary!  Although this means missing all those discussions over coffee, the poster sessions and the lively Q&A sessions with the speakers, it meant I could still get the gist of the new giant planet system research being presented by my friends and colleagues.  With Cassini presently executing high-inclination orbits around Saturn; a strong showing for outer solar system exploration for ESA's L-class science proposals; Juno en route to Jupiter in 2016 (it swung by Earth for a final gravitational assist in October) and the ESA JUICE mission gathering speed to its 2022 launch, there's plenty to be excited about.  In this first post, I'll focus on the latest news from the Ice Giants, Uranus and Neptune.  Uranus' northern hemisphere is emerging into spring sunlight after the northern spring equinox of 2007, with the atmospheric dynamics, brightness and polar banding responding to the increased sunlight.  Neptune's Southern Hemisphere remains in summer sunshine after the 2005 equinox, with the northern winter hemisphere hidden from view.  2013 saw the emergence of an extremely bright storm feature at 45S being tracked by amateurs and professionals alike.

Uranus from the Great Observatories
Uranus from Damian Peach (2013)

In 2013 Uranus and Neptune are truly within reach of the most talented amateur observers, with observers able to see the polar collars of Uranus in strong methane absorption (e.g., this image from Damian Peach) and track distinct bright storm-like features on Neptune (e.g., the excellent blog from Christophe Pellier).  However, in the absence of any dedicated ice giant missions, today or in the near term, we rely on the resources of the 'great observatories' to reveal new insights into the composition of Uranus and Neptune.  Cavalie et al. (DPS & EPSC) used the Herschel Space Observatory to detect CO in the Uranian atmosphere, using the sub-mm spectra to understand the potential origins of this stratospheric species - material from icy rings/satellites, interplanetary dust or potentially large cometary impacts (such as CO in Jupiter's atmosphere after the Shoemaker Levy 9 collision, Bezard et al., 2002). Fry & Sromovsky (DPS) report Hubble observations of Uranus from September 28th 2012 using STIS to measure spectra from 0.3-1.0 µm now that the north pole is coming into view (we passed Uranus' spring equinox in 2007).  These observations indicate that methane depletion at mid-to-high latitudes in Uranus' troposphere is symmetric about the equator - i.e., it's not seasonally-forced like the atmospheric brightness or discrete cloud features.  This high-latitude depletion of methane has implications for how Uranus' atmosphere redistributes material from equator to poles.  Finally, Moses et al. (DPS) interpret the equinoctial Spitzer observations of Uranus by Orton et al., using a photochemical model to interpret the relative abundances of the soup of hydrocarbon and oxygenated species in Uranus' stratosphere.

Uranus in July 2012 from Keck II telescope.
...and from the Ground...

Improvements of adaptive optics (i.e., giving better spatial resolution) and spectral resolution in diagnostic wavelength bands means that ground-based observatories also plug the remote sensing gap for the ice giants.  Irwin et al. (EPSC) presented near-IR images and spectroscopy of both ice giants from Gemini and VLT in 2009, finding similarities in the scattering properties (and hence composition) of their main 2-3 bar cloud decks, and near-identical deuterium-to-hydrogen ratios suggesting that these two worlds shared a rather similar origin.  Tice et al. (EPSC) used an integral field unit (SWIFT) with Palomar's AO system to produce high-resolution 0.65-1.0 µm spectra of Neptune, using them to investigate the latitudinal distributions of clouds and methane on the most distant ice giant.  Roman et al. (DPS) presented H- and K-band images and spectra of both planets from Palomar between 2001 and 2007, using them to determine the distributions of clouds, aerosols and para-hydrogen (a tracer of atmospheric motion and chemical equilibriation).  de Pater et al. (DPS) report a multi-wavelength campaign of near-infrared, thermal-infrared and microwave observations of Neptune from Keck and the VLA in 2003, particularly focussed on the warm temperatures and volatile depletion near the southern summer pole.  In a similar vein, Norwood et al. (DPS) use microwave observations to determine the chemical abundance of Neptune's troposphere (e.g., the volatiles H2S and NH3).  Iino et al. (EPSC) used 2010 observations from the 10-m NOAJ Atacama Sub-Millimetre Telescope Experiment (ASTE) to measure CO, HCN and CS (not detected) in Neptune's atmosphere, and show that the ratio of CS to CO is 300 times smaller on Neptune than on Jupiter, casting doubt on ideas of cometary origins for Neptune's atmospheric composition.

Beyond the observations, numerical models are attempting to understand how an ice giant atmosphere circulates, and how this differs from the gas giants.  Sussman et al. (DPS) explored the dynamics of planets with axial tilts exceeding 54 degrees (i.e., the poles receive a greater insolation than the equator when averaged over a year), and showed how the fine balance between thermal gradients and Rossby wave generation and propagation governs whether you'll get eastward or westward jets at mid-latitudes. The remarkably uniform temperature gradient on Uranus suggests that the mechanisms transporting heat latitudinally are rather efficient.  Kaspi et al. (DPS) report on their recent Nature article, using the gravitational fields of the ice giants (particularly the fourth gravity harmonic determined from Voyager and HST observations) to constrain the atmospheric 'weather' to the outermost 0.15% of the mass on Uranus and 0.2% on Neptune (i.e., a thin layer no more than 1000 km thick).  Finally, Friedson (DPS) discusses reasons why the heat flux from an ice giant might be small - water is sufficiently abundant in its condensation zone that both 'ordinary' and 'diffusive' convective transport are inhibited (i.e., the layer is stable), limiting the transport of heat to nothing more than a weak, oscillatory convection which does a poor job at moving energy upward through these atmospheres.

Looking to the Future

With ESA's next round of large-class cosmic vision proposals just around the corner, interest in an ice giant mission was strong throughout 2013, with three white papers (Uranus Pathfinder by Arridge et al., a Neptune mission from Masters et al., and the dual ODINUS concept from Turrini et al.) submitted for the call for science themes, not to mention my own efforts with Olivier Mousis for an ice giant entry probe.  Along with several others, I helped organise a 3-day workshop in Paris in September called "Uranus Beyond Voyager 2" - the rich discussions from this meeting were summarised in a recent blog post by Geraint Jones.   Hopefully the community will build on these new scientific results and collaborations as we prepare to respond to new ice giant mission calls in 2014 and beyond!