Friday 18 December 2020

Saying Goodbye to the Royal Society

Last day of "School", and a bittersweet ending for me - after 8 years, my @royalsociety research fellowship is coming to an end.  The URF picked me up at a desperate point in 2012 (I was a new Dad, with no job beyond the end of that year), and I can't overstate my gratitude.  

Some highlights of working with @royalsociety during this time: funding two superb PhD students (@RohiniGiles and @ortk95), summer students, and giving me the flexibility to manage an ERC-funded planetary atmospheres research team at Leicester. 

Running the @IcyGiants discussion meeting in 2020, along with a photo I'll treasure from the Marble Hall.  Participating in the #SummerScience exhibition in 2018.  'Meet the press' events at Carlton House.  Just sitting in the fellows room with a coffee.

Judging the 2018 Investment Science Book prize, working with an amazing panel, being invited to the Hay festival, then meeting all the authors on the shortlist.  A trip to St. James' Palace with the other URFs and DHFs. 

And being allowed to view the planetary and astronomy treasures (Newton's death mask, books by Galileo, Cassini, Herschel, Huygens...) in their archives, showcasing them to amateur Jupiter observers after a Juno meeting in 2018. 

But of course the biggest thing to be grateful for - giving me the opportunity to move from Oxford to Leicester five years ago.  Felt like an enormous decision at the time, but no regrets. So, raising a mulled wine to @royalsociety today, and let's see what 2021 brings.


Tuesday 13 October 2020

On ESO and TIMMI for Jupiter

H/T to Ulli Kaufl for showing this quote from Low&Rieke (1974) on early thermal-IR @ESO_IR2020: "Observing at 10 µm has been likened to observing visually through a telescope lined with luminescent panels and surrounded by flickering light as though the telescope were on fire..." 

I also never knew that the TIMMI instrument on @ESO's 3.6-m telescope observed the Shoemaker-Levy 9 comet collision with Jupiter at 10 µm back in 1994, sensing ammonia gas and debris lofted into the stratosphere (Credit:ESO)

Image
...and I didn't know that the successor TIMMI2 was also observing Jupiter in 2000 (left, showing thermal waves later seen by Cassini) and 2004 (right). Seems we have more archival Jupiter thermal-IR data than I realised... (Credit:ESO)

ls.eso.org/sci/facilities…ImageImage

Tuesday 22 September 2020

#PlanetBites: On Ice Giants as Laboratories for Convection

This blog post is based on a White Paper and #EPSC2020 presentation by Tristan Guillot, available on Vimeo.  Uranus and Neptune are key to the understanding of planets with hydrogen atmospheres. These are the last worlds never to have been visited by an orbiter, and are probably the building blocks for formation of giant planets.  Their interiors and evolution, and hence their composition, are poorly constrained.  They are unique laboratories for understanding heat transfer, compositional variations and temporal variations.  These planets are active, with methane clouds, seasonal variations, and activity most probably linked to convective phenomena.  


What have we learned from the other giants, like Juno at Jupiter?  Equilibrium cloud structures have methane clouds near the top of the observable atmosphere, where the optical depth is relatively low.  This is opposite for the water clouds in Jupiter and Saturn.  Juno has shown that the atmosphere is not as simple as we expected.  Ammonia is varying in altitude and latitude down to great depths, tens of bars or more.  The presence of water storms lofting ice crystals, that dissolve ammonia, and then bring down ammonia and water gas down to great depth.  This precipitation forms intense cold downdrafts that can penetrate deep.  How deep to they fall with no surface?  Hydrogen atmospheres always have heavy condensates, contrary to the earth case.  Downdrafts in the Sun are important for the solar convective zone.

Moist convection can be inhibited by composition.  The molecular weight effect inhibits convection locally, and this occurs when water is more abundant than 10x solar, and methane more abundant than 40x solar, so should occur on Saturn and the Ice Giants.  Furthermore, we don't know what the temperature profiles look like below the 1-bar level - what sort of adiabats should they follow, and what are the implications for interior modelling?

We need to evolve from a standard picture of uniform clouds based on equilibrium, to something that is more variable with strong updrafts, precipitation, and downdrafts.  We know that clouds are extremely important for understanding hot and warm Jupiters and their compositions, and also important for brown dwarfs.  A mission is sorely needed, with an orbiter and a probe.

#PlanetBites: On ESA's Jupiter Icy Moons Explorer

At #EPSC2020, Olivier Witasse described the JUICE mission to Jupiter, a European mission to explore the emergence of habitable worlds around gas giants.  The mission will explore the icy moons Europa, Callisto and Ganymede, particularly their internal oceans, as well as the Jupiter system globally (the atmosphere, interior, and magnetosphere).  The aurora of Jupiter show the invisible link between the planet and its wider system, the moons and rings.  


Olivier showed schematics of the spacecraft.  We have almost 90 m2 of solar panels, with a complex deployment sequence.  The optical bench is on the top, with the remote sensing instruments.  On the bottom is the 10-m magnetometer boom, with magnetic and plasma sensors.  There is a long boom for the radar, and smaller booms for plasma parameters.  Two antennas, the high gain antenna and medium-gain antenna will be used for the radio science subsystem, and there are ten instruments in total.  

The video shows movies from Airbus in Germany.  All instrument teams are working hard to build, test and deliver the flight models to the industrial contractors - so far two are delivered to Airbus (UVS from San Antonio, and RPWI from Uppsala), with thermal vacuum tests due at ESTEC in January 2021 being the next big milestone.  COVID has reduced the margins, with still one month in reserve for a launch in May 2022 from Kourou with Ariane 5.  Backup launches in Sep 2022 and Aug 2023 have also been studied.

JUICE has a complex and interesting mission profile, 7.5 years to Jupiter, arriving in 2029 for a 2.5 year orbital tour around Jupiter, making flybys of the icy moons.  In Sep 2032 JUICE will end up in Ganymede orbit, to study the largest satellite of Jupiter down to 500 km above the surface.  

JUICE is a challenging mission - the mission lifetime; the radiation environment requiring shielding; the thermal environment from the hot Venus to cold Jupiter; the power is an issue far from the Sun even with large solar arrays producing 1000 W; and some strong EM requirements, making the design complex.

Navigation is also challenging with two orbit insertions, and many flybys.  We have to address planetary protection, never impacting Europe, plus some power and data rate constraints.  Lastly, for a mission lasting 30 years from idea to the end of mission, we need to ensure we have all the knowledge available throughout.


https://sci.esa.int/web/juice/-/-6-start-of-assembly-and-integration-for-juice

Olivier shows some images of the spacecraft, with the tanks being inserted at the end of 2019 and the high-gain antenna undergoing tests, showing the size of this enormous spacecraft.  The spacecraft is really taking shape now, waiting for the instruments to be integrated.  


Pro-Am Support for Juno

This workshop, organised by Ricardo Hueso, is a continuation of previous meetings in Nice (2016) and London (2018), making stronger links between the Juno mission and the efforts by the amateur community to produce a near-continuous record of atmospheric activity on Jupiter.  EPSC meetings have always had an amateur astronomy contribution, making it unique amongst planetary conferences - it's just a shame we were not able to meet again in person!


Image Processing for Jupiter

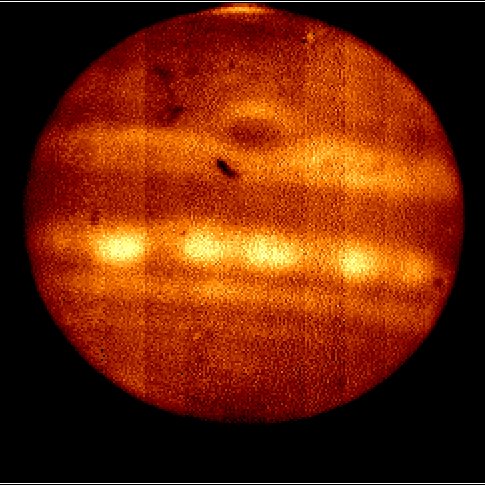
Christopher Go started proceedings on how to improve planetary image processing, describing his basic workflow and new techniques in processing.  An exciting new development for planetary imaging is the Sony IMX462C back-illuminated CMOS chip, with very high sensitivity in the infrared, allowing them to capture very high-resolution methane band observations compared to the older IMX290M.  Chris recommends "taking care of the little things" - seeing is the most important thing, which requires location, location, location.  Local conditions can affect this, such as heat sources nearby (the warmth of the cement near his home), so Chris sprays the floor with water a few hours before imaging.  He recommends watching the jetstream, using www.stormsurfing.com - if you're underneath it, it might not be worth going out imaging.  Set up the OTA early and cool it down, using a cooling fan to reduce tube currents (e.g., Chris uses a vacuum cleaner!).    The mirror needs to be locked after focussing to prevent focus shifts, never over-tightening the bolts, which would distort the mirror.  Collimation needs to be done with a camera on, not with the eyepiece in, as a slight shift can occur.  Chris is often asked what settings he uses for his camera, like exposure time and gain.  These are immaterial, as he changes them depending on transparency and seeing - he uses the histogram close to 90% with FireCapture gain control.  For high-quality captures, he emphasises the need to find the sweetspot of the system, use the fastest frame-rate possible, spend time to focus, don't be gain-shy, and capture a lot of data.  For Jupiter, he focusses using Io or Europa. 

Once he has the images, he performs derotation with WinJupos, which allows observers to stack beyond the time limit set by the rotation of the planet.  This derotation is so good, Chris even uses it to process Hubble images, even though a typical Hubble image is only 15 minutes long.   He uses something called Topaz Labs in Photoshop in methane-band images to pull out the details.  Finally, Chris states that "the goal of planetary imaging, is not to acquire beautiful images, but to provide useful data."

Current Events on Jupiter

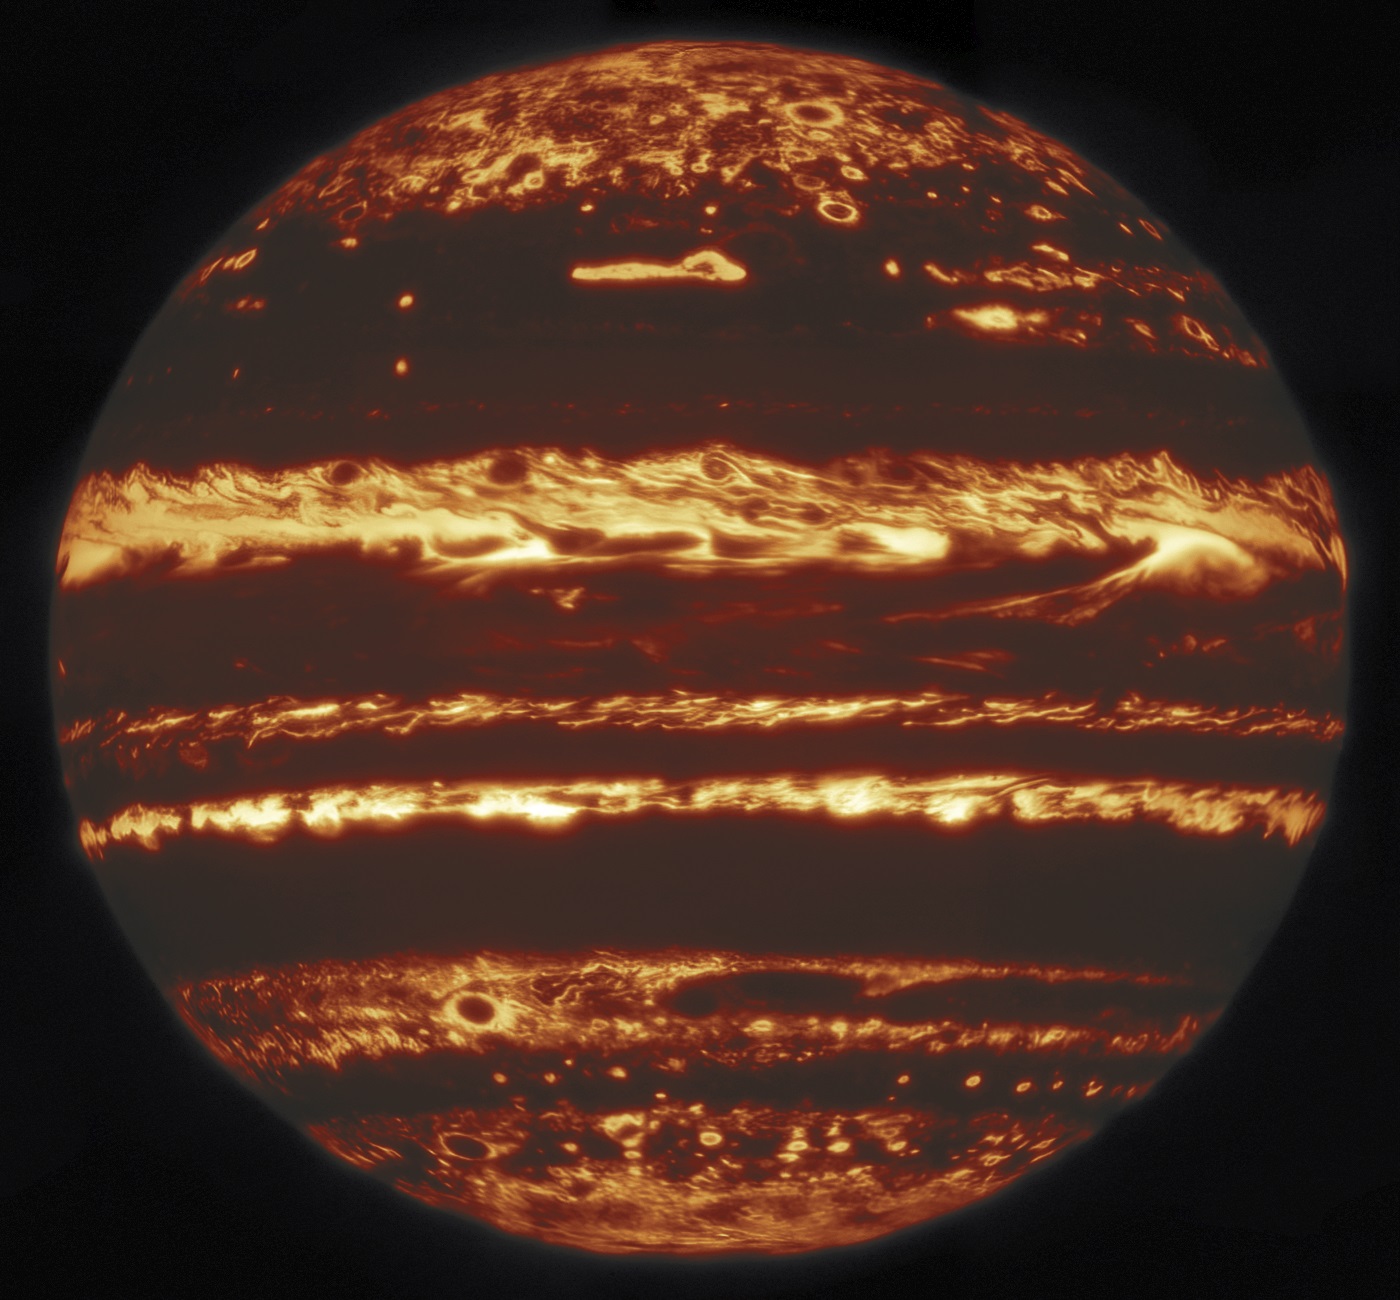
North Temperate Belt:  John Rogers picks up the reigns with a review of current phenomena on Jupiter in 2020, and how it fits in with the long-term patterns of Jupiter's climate (cyclic patterns of events, sometimes regularly, sometimes irregularly).  The most recent is the NTB south jet outbreaks, which usually occur every five years, but this one has erupted after only four years.  One or more brilliant plumes erupts at the latitude of this jet, spreading a disturbance all around the planet.  The first plume erupted on August 18th, the brightest feature on the planet in the visible and methane band, showing that it had punched up above the usual cloud deck.  It has developed and expanded since, with two further plumes erupting in the weeks that follow at completely different longitudes.  Animations over several weeks show the plumes moving eastward, with a wake of dark spots and chaotic regions behind it.  One big dark spot - an anticyclonic vortex - appears roughly every five days.  On September 1st, a second outbreak appeared, expanding in the same way as the first.  On September 8th, a third one appeared.  We expect each one to collapse and decay when it catches up with the tail of the previous one, and Shinji Mizumoto at ALPO-Japan has been doing some very careful tracking of this process.  Plume 3 already appears to be disappearing, and we expect Plume 2 to disappear in late September, and Plume 1 by mid-October.  The turbulent wakes them coalesce into a dark NTB south component, which will then become orange over time.  Juno's PJ29 passed just a few days ago, but sadly did not cover the current outbreak.

North Tropical Domain:  In the North Tropical Domain we observe NEB expansion events (where the brown belt expands northwards) every 3-5 years.  The most recent one was in 2017, and a new event started in April 2020, possibly initiated in February from a bright rift around "White Spot Z" (a large white anticyclone).  In the wake of the rifted region, some sections of the NEB were drifting northward.  The belt had big dark patches, and some brighter cyclonic areas.  By September the belt has expanded all the way around the planet.  From here on, we expect a series of barges and Anticyclonic White Ovals (AWOs) all around the expanded northern NEB, but at the moment the NTB south outbreak could be disturbing this process.

Equatorial Zone:  This typically-white zone has been vividly coloured over the past couple of years.  This event began in 2018, peaked last year, but is still there today.  As of this summer, it looks stable and distinct as an ochre belt.  Maybe things are being brought up from the deeper atmosphere and "being cooked" by UV light to create the ochre colour. 

South Tropical Domain:  In the South Tropical Domain, the SEB is the only belt not undergoing any special cycles right now.  It is unusually pale in the northern half, but there remains plenty of convective disturbance in the wake of the Great Red Spot, so no evidence of a fade any time soon.  Its always possible that a new mid-SEB outbreak can occur at any time.  Right now, some little vortices entering Red Spot Hollow are still pulling flakes out of the Red Spot, continuing the activity seen in 2019.  It's still happening, and was observed again this month.  The GRS has begin shrinking again this year, even though the flaking events haven't been quite so impressive, so will this be a stable decline or will it recover again?

Finally, the South Temperate Domain, which consists of structured sectors that appear and propagate around the planet on an otherwise blank domain.  There's always two or three of these, one at the moment adjacent to Oval BA, and another at the following end of the STB spectre.  We are expecting a new structure to arise preceding Oval BA, arising from cyclonic vortices.  The appearance of "Clyde's Spot" from the small white spot in STB latitudes might be a precursor of this, and was observed by JunoCam during PJ27.  This short-lived plume left a darker spot that has continued to be turbulent, and maybe the dark spot will evolve into a new structured sector.

Juno and JunoCam

Glenn Orton from JPL joined from California, mentioning that they finally have clear air after the winds have shifted from the Bobcat fire, and the Mount Wilson observatory has been saved.  Glenn's role on the Juno mission was to provide ground-based observations to support the mission.  These are needed to improve the spatial coverage over the globe where Juno is not observing; to provide context in time to track the evolution of features; to provide spectral coverage in ranges that are not covered by Juno instrumentation, and to provide simultaneous coverage of multiple components of the jovian system (e.g., Io).

The nominal mission ends at PJ34, in June 2021, but a proposal will soon be submitted for an extended mission, with a maximum of 76 orbits up to May 2025, providing high resolution coverage of Jupiter's northern hemisphere and pole, with multiple flybys of Io, Europa, Ganymede, as well as a characterisation of the ring system.  Supposedly we'll know the outcome towards the end of this year.  Very late on, there'll also be opportunities for radio occultations of the jovian atmosphere.  One caveat is that we'll be going into a treacherous part of the magnetosphere, an increasing challenge for the spacecraft.

Candy Hansen emphasises that the Juno mission also has artists involved, and not just scientists and engineers.  JunoCam, a push-frame imager built by Malin Space Science Systems, is on the payload to allow the public to participate in a planetary mission, and the great science is a bonus.  At the closest point, JunoCam is observing the storms from just a few thousand kilometres up.   JunoCam collects data for only 2 hours out of a 53-day orbits, so amateur observations are essential to fill in the gaps.  Lighting is everything to an imaging experiment.  When Juno arrived, the orientation of the orbit meant we were looking at the terminator region.  As time went on, it became more challenging to observe, but now the orbit is evolving, and we'll come over onto the dusk side of Jupiter, allowing us to get great images with nice shadows.  The orbit is evolving into a more southerly orientation, getting close to the north pole, with a long period to image the southern hemisphere (albeit at worsening resolution).  The closest approach will be at a latitude of 28N by the nominal end of mission on PJ34, reaching 63N by the end of PJ75.   For a little outreach camera, there's an awful lot of science being done.

To monitor the health of the camera, one image is taken every PJ pass with all the same settings, so we have a record as the orbit evolves to show how the camera is changing.  Up to now, there is no sign of permanent damage, just a little more radiation noise, so they expect to survive right to the end of the mission.

Kevin Gill then described the image processing pipeline he uses for JunoCam images.  Kevin is one of many people who process these images.  He's an engineer at JPL, but does the processing on an amateur basis.  The raw data has long framelets, used to produce the map-projected colour images.  Kevin takes the raw framelets, as it provides better options for colour calibration.  His pipeline produces maps, which then inform wide-angle perspective views, cylindrical projected detailed shots with some enhancening and sharpening; fish-eye composites (ultra-wide angle views that makes it look like you're seeing the full disc).  His code also outputs meshes for 3D programmes like Blender.  He's also working on stereographic images, as best he can given the dynamic nature of Juno's orbit and the interval between observations, as well as fly-over movies.  The automated pipeline is open source and can be found on his github, uses ISIS3 and Spice.  He then uses manual processing for the reprojection and combination if he's making a composite of multiple observations, using the ISIS3 suite.  Blender, Photoshop, Topaz Denoise (very carefully!) and Lightroom are then used to produce his output products.  This not a scientific approach, but provides a visually pleasant view (Ed: that's an understatement!).  

The Value of Long Term Monitoring of Jupiter

Finally, Arrate Antunano gives a presentation on how the data you're taking today might be of value to those researching Jupiter in the decades to come.  Different planets display diverse cyclic activity in their weather and climate patterns.  Jupiter has dramatic planetary-scale disturbances that completely alter the planet's appearance.  Most studies deal with just snapshots of observations, usually as a result of one phenomenon that captures the imagination at the time.  But what is the big picture here?  How do things change in the long term?  How cyclic are these events?  Are there correlations between different events?

Long-term monitoring of Jupiter's atmosphere, highlighting the expansion and contraction of the north equatorial belt - credit: Fletcher et al. (2017)

Ground-based observations are a goldmine for researchers.  At infrared wavelengths, we have around 40 years of observations available since the early 1980s, providing great temporal coverage.  Checking the Planetary Virtual Observatory and Laboratory (PVOL), the amateur observations span 2000 to 2020, and even older observations are present in the ALPO-Japan directory.  These long-term observations at multiple wavelengths allows them to characterise temperature, composition, and aerosol changes.  

Examples of these cyclic activities include the cloud-clearing events at the equator, where the equator brightened at 5 microns with a period of 7-years or so.  This brightening h appens at the same time as the visible coloration events at the equator.  The aerosol opacity decreases at the 400-600 mbar level, where the ammonia clouds are. However, we didn't see any change in ammonia or temperature, so this rejects the idea that the cloud-clearing is due to warming and evaporation of clouds. Maybe changes in the deep ammonia gas are responsible, but this is something that Juno has not yet investigated.  Also using 5-micron data, some changes in the bands are observed to be anticorrelated, particularly between changes in brightness of the NEB and SEB.  Finally, looking at 7.9 microns, which senses Jupiter's stratospheric temperatures, reveals how Jupiter's equatorial stratospheric winds change with time.  We've known this for 30 years, but new results published in Nature Astronomy show that Jupiter's equatorial stratospheric oscillation has been disrupted twice, completely switching into a new period, and these changes coincide with substantial disturbances in the deeper atmosphere.  This is unexpected, and hasn't been observed on Earth or Saturn, which have similar equatorial stratospheric oscillations.  

The long-term Jupiter observations are critical for this exploration of natural jovian cycles, and Arrate would like to continue this study with reflected sunlight observations, to understand the vertical extent of the events and their interconnectivity with the deeper atmosphere,  so that we can maybe predict these events in advance to be ready with our telescopes.


The Pro-Am community at the 2018 meeting at the Royal Astronomical Society in London.


Monday 21 September 2020

Ice Giant Science at EPSC 2020

This blog post has been written in preparation for the 2020 Europlanet Society Congress, which will be held virtually from September 21st.  Contributors were asked to submit pre-recorded video presentations or 6-slide virtual posters, which would be viewed asynchronously at a time convenient for the audience.  Each presentation and poster was accompanied by a text-based chat for questions, allowing for asynchronous discussion of the various presentations.  However, in an effort to advertise the individual sessions and to ensure a lively discussion, the EPSC 2020 organisers scheduled short 20-minute science showcases, to be delivered by the session conveners or a selected presenter.  This blog represents a summary of the Ice Giant science being presented at EPSC2020, grouping the abstracts into themes.  We urge you to visit and participate in the discussion of the individual contributions, and hope for a lively meeting.


1. Ice Giant Atmospheres

Guillot (514) discusses how the Ice Giants can be used as a laboratory for methane-driven convection and storms, providing insights into how moist convection works in atmospheres where the condensates are heavier than the surrounding air.  They point out that the methane clouds are more readily accessible than the water clouds of Jupiter and Saturn, making this a fascinating regime to study via future missions.

Sticking with this theme, Hueso et al. (354) describe a programme of Earth-based observations of Neptune in 2019, using contributions from amateur observers to fill time-gaps between large-class facilities like Hubble.  The data suggest more variability but less cloud activity in 2019 than previously, and the team uses the observed cloud features to reassess Neptune’s zonal winds.  In addition, Sato et al. (080) study the evolution of dark spots and storms on Neptune via the 1.6-m Pirka telescope of Hokkaido University in 2018, using the spectrum in the near-infrared to estimate the drift rate of a storm.

The nature of the clouds themselves are explored by Toledo et al. (593), who present constraints on the formation of hazes and clouds from a coupled cloud-haze microphysical model, used to understand the vertical structure and evolutionary timescales of ice giant aerosols.  Irwin et al. (241) describe observational constraints on clouds and methane in Neptune’s atmosphere, via fitting visible-light spectroscopy acquired by the VLT MUSE instrument in 2018, using the observed limb-darkening to discriminate between methane and aerosol contributions to the spectrum, and confirming the strong equator-to-pole gradient in methane gas on Neptune.

Moving into the stratosphere, Rowe-Gurney et al. (244) use Spitzer observations to reveal the properties of Uranus’ stratosphere, discovering a variation in emission as a function of longitude as the planet rotated in 2007.  They demonstrate that these changes are the result of stratospheric temperature variations, and relate it to small-scale structures in bands of warm mid-latitude emission on Uranus.  Roman et al. (471) use thermal infrared observations of Neptune over the past two decades to reveal surprising changes in emission, implying that processes occurring much faster than a Neptunian season are significantly modifying the temperature and/or chemistry of the stratosphere, with a substantial change occurring between 2006 and 2008.

Finally, Milcareck et al. (297) describe the development of a general circulation model for Uranus and Neptune, using state-of-the-art radiative-equilibrium models (Vatant d’Ollone, (292)) and reproducing the broad structure of Ice Giant wind fields, but generating a number of open questions concerning differences between the two planets.


2. Planetary Origins and Interiors

Turning to the bulk composition of the Ice Giants, Cavalie et al. (053) explore Ice Giant chemistry via a combination of chemical modelling and Earth-based compositional measurements, concluding that a combination of in situ atmospheric probes and remote sensing are required to understand Ice Giant composition.  Mousis et al. (613) describe a model of the outer region of the proto-solar nebula to understand how materials might have been delivered to the Ice Giants to explain the observed elemental enrichments of Uranus and Neptune.  They suggest that these planets accreted from building blocks of grains and pebbles that condensed in the vicinity of the N2 and CO ice lines.

Scheibe et al. (640) attempt to reconcile thermal evolution models with the extreme differences in intrinsic heat flux between Uranus and Neptune, proposing and studying a conducting interface that inhibits energy transport between the ice-rich interior and the outer atmosphere.

Moving from the planets to the satellites, Li & Christou (769) revisit the idea that Triton and Nereid, by virtue of their peculiar orbits, must have been captured by Neptune.  By assuming instead that the satellites formed in situ around Neptune, but were then perturbed during the period of instability suggested by the Nice Model, a small number of satellites survive the encounter and can gain Triton-like or Nereid-like orbits, challenging the conventional capture model.


3. Magnetospheres and Upper Atmosphere

Gershman & DiBraccio (258) study how the solar wind couples to the Ice Giant magnetospheres, showing how solar wind magnetic pressure changes influence the strength of the coupling, and therefore hinting that magnetospheric dynamics may have a strong dependence on the solar cycle, being strongest at solar maximum.

Two techniques are explored for studying the upper atmospheric emission.   Melin et al. (268) continue to monitor the long-term cooling trend of Uranus’ upper atmosphere using near-infrared emission from the H3+ ion, showing cooling by 8 K per year since records began in 1992 that they relate to the changing geometry of Uranus’ magnetic field and the solar wind over the past three decades.  And Thomas et al. (797) report on the ongoing attempts to detect Uranian auroras via emission from H3+, to supplement previous detections in the ultraviolet.  They used NIRSPEC on Keck in 2006 to identify fast changes in intensity that are suggestive of auroral processes, potentially the first spatially resolved infrared images of Uranian auroras.

Finally, Dunn et al. (1028) also continue to search for X-ray emissions from the Ice Giants, using Chandra observations of Uranus to show two non-detections during solar minimum and one statistically significant detection during solar maximum consistent with an X-ray emission from charge exchange or scattering of solar photons.


4. Future Missions and Instruments

The final theme of this EPSC session concerns a look ahead to future missions.  Blanc et al. (984) describe the outcomes of the “Horizon 2061” foresight exercise, suggesting questions that could be addressed via a long-term plan for Ice Giant exploration, potentially with one or more spacecraft and making use of gravity assists in the 2030s.  Costa Sitjà et al. (878) consider the opportunities that a long cruise to Uranus and Neptune might provide, by developing a tool to assess potential flyby encounters enroute to Neptune, searching for Jupiter Trojans, Centaurs, Trans Neptunian Objects and Jupiter Family Comets, with the aim of ultimately optimising trajectory designs.

Probst et al. (435) introduces a tool that investigates the feasibility for planetary entry probes accessing different latitudes on Saturn, Uranus and Neptune, looking at how different trajectories, approach angles, and probe designs impact the available probe sites, which will provide crucial insights for mission development.  For such an atmospheric probe, Irwin et al. (306) describe the needs for a net flux radiometer instrument, able to measure the upward and downward fluxes of solar and thermal radiation as the probe descends.  They evaluate how such an instrument would constrain both the radiation energy budget and the properties of the clouds and haze layers.

In addition, Molina-Cuberos et al. (523) discuss the potential for in situ probes measuring electrical properties of Ice Giant atmospheres during the probe descent.  Using a model developed for Mars and Titan, the authors show how important aerosol properties are to the observed ionisation and electrical conductivity.

Tortora et al. (1042) describe the proposed Discovery-class Trident mission to Triton, specifically focussing on the capabilities of the radio science instrument to study electron densities, neutral atmospheric temperatures, and the thickness of Triton’s hydrosphere.  And Lamy et al. (941) discuss the variety of radio emissions from the “radio twins” Uranus and Neptune, and how a digital high-frequency receiver could provide a low-resource instrument to study auroral and atmospheric radio and plasma waves or dust impacts.


Europlanet Science Congress (EPSC2020)

Welcome to the first day of #EPSC2020, our first major virtual conference!  The conference is the annual gathering of the Europlanet Society, the first of which was in 2006.  This has been a labour of love since the spring, when we realised that we would not be meeting together in Granada this year.  Today, a year on from a fabulous conference in Geneva, the planetary community is now spread around the world, watching from home offices and COVID-safe workplaces, and there's no way it'll be quite the same.  But we've done our best to deliver a conference that makes the most of the virtual environment we find ourselves in, being cautious not to overwhelm people with Zoom, whilst hoping to showcase the incredible diversity of European Planetary Science.


Links on the homepage (https://epsc2020.eu) and the programme, but you have to click on the "live briefing" link, enter your login details, and then you get the Zoom link and password.  The live sessions and commenting on the conference are restricted to registered attendees.  

There are many ways that you can do a live meeting, so we did our research on some of the "best-practice" techniques for how others had approached them.  One thing we were sure of was that we didn't want to translate our normal EPSC directly into a virtual meeting, with very long days and lots of parallel sessions.  In particular, we were keen to build on the "nearly-carbon-neutral" conference scheme that had been developed as a means of mitigating the climate crisis.  Following this, EPSC2020 is spread over multiple weeks, with orals and posters replaced by videos and short slideshows that are all pre-recorded so that the audience can digest them at their own leisure, irrespective of time zones.  There were over a thousand abstracts submitted, more than 2/3rds of which were videos (some are public on our Vimeo page, some are private and only accessible on the EPSC website).  We're hoping that the asynchronous discussions will be helpful for people, allowing them to think about questions carefully before answering them, without the terror of standing in front of an audience of 500 people.  

Distribution of #EPSC2020 sessions by programme group.


This will be combined with a programme of live sessions:  a live briefing and interviews with key members of the European community in the morning, with keynote lectures and short courses in the afternoon.  These are combined with 20-minute long session showcases, where the conveners give a short summary of the asynchronous sessions.  These are kept to short blocks, one in the European morning (benefiting our colleagues in Asia), and one in the European afternoon (benefitting our colleagues in the US).  All will be recorded, so that people can catch up in their own time.

This is the first time that we, the organisers, have attempted anything quite like this, and it'll rely on goodwill and participation from the community to make it a success.  Fingers crossed for a successful meeting!


Thursday 17 September 2020

Planetary Science Journals

Choosing where to publish your research is a nightmare - we tend to base the choice on cost, ability to avoid stringent word counts/figure counts, and a nebulous concept of journal quality.  In an ideal world none of this should matter - science should all be open access for free (e.g., arXiv), referees should be high-quality and rewarded for their work, and no one would pay any attention to impact metrics.  A non-exhaustive list of publications is below:

  • Nature (plus Nature Astro, Nature Geophysics) and Science.
  • Planetary Science Journal (PSJ, replacing AJ and ApJ for planetary studies):  as of 2020, this gold OA journal charges $61 per text quanta (350 words) and $53 per figure/table.  So 10,000 words and 5 figures would come to around $2000.
  • Nature Communications is an OA journal generally considered above Scientific Reports.  They publish 5000-word articles and up to 10 display items.  The open-access fees are $5,380 as of 2020.
  • Scientific Reports (part of Nature) is a gold OA journal that publishes ~4500-word articles, 8 display items, with an article processing fee of $1870.
  • Science Advances (part of Science) is a gold OA journal with a base article processing charge of $4500, but allows up to 15,000 words and 6 display items.
  • JGR: Planets (of which I'm an associate editor) charges a $1000 fee (£3500 for gold OA) for articles, plus $125 for every publication unit (500 words or one display item) over the standard limit of 25.  So 10,000 words and 5 figures should cost you $1000 (NB currently half the price of PSJ).  Managed by AGU.  
  • Geophysical Research Letters only accepts papers of 12 publication units (500 words or one display item), charging $500 per article ($2500 for gold OA) and $125 for excess units (which aren't typically allowed).  Managed by AGU.
  • Below JGR and GRL sits Earth and Space Science (ESS), also managed by AGU.
  • Icarus has long been regarded as the journal of choice for the Division of Planetary Sciences, and does not charge an APC (unless gold OA is sought).  Colour reproduction of figures incurs fees.  Managed by Elsevier.
  • Planetary and Space Science - similar to Icarus in fees, also managed by Elsevier.
  • Space Science Reviews.
  • Astronomy and Astrophysics.
  • Monthly Notices of the RAS.
  • Philosophical Transactions of the Royal Society (by invitation only).


Thursday 7 May 2020

Hubble and Juno

Mike Wong invited me to be a co-author on his excellent paper in ApJ Supplement, which describes the Hubble and Gemini support programmes for the Juno mission:

Wong, M.H., A.A. Simon, J.W. Tollefson, I. de Pater, M. Barnett, A.I. Hsu, A.W. Stephens, G.S. Orton, S.W. Fleming, C. Goullaud, W. Januszewski, A. Roman, G.L. Bjoraker, S.K. Atreya, A. Adriani, L.N. Fletcher (2020), High-resolution UV/optical/IR imaging of Jupiter in 2016-2019, The Astrophysical Journal Supplement Series, Series, 247, 58 (25 pp.) (http://dx.doi.org/10.3847/1538-4365/ab775f)

Credit: International Gemini Observatory/NOIRLab/NSF/AURA M.H. Wong (UC Berkeley) and team Acknowledgments: Mahdi Zamani.


Images from both facilities were released to the public and created quite a splash, with the Gemini "lucky imaging" at 5 microns even making the BBC website.  Here is a collection of the media releases:

Hubble Space Telescope
Gemini Observatory
Berkeley

The full dataset is also available via open access on the MAST archive.

Combined data from the Juno spacecraft, the Hubble Space Telescope and the Gemini Observatory reveal a special cloud structure near a massive cluster of lightning flashes: a three-way combination of deep clouds made of water, large convective towers — essentially Jovian cumulonimbus — and clear regions with downwelling, drier air outside the convective towers. (Image courtesy of NASA, ESA, S. Brown of JPL, M.H. Wong of UC Berkeley and A. James and M. Carruthers of STScI)

Wednesday 6 May 2020

Recording Powerpoint

I've been wrestling with how to record myself delivering Powerpoint slideshows, as research has shown that your audience is more engaged when they can see the speaker.

In Powerpoint for Windows (with a 365 subscription) it seems that you can record both Audio and Video narration while you deliver your slides, but there doesn't appear to be a way to do this in Powerpoint for Macs (and I have the latest versions).

There is a brute-force approach using Zoom (thanks to Anita Heward for pointing this out) - you can start a personal meeting room, turn on your video, and share the screen (or just the Powerpoint window).  The Shift-Cmd-R starts and stops the video recording.  Once the meeting is ended for all participants, the recording is saved as an MP4 in my Movies directory.

Another colleague pointed me towards the free Open Broadcaster Software (OBS) Studio, and this seems to have solved my problem for me with even more control over content.


  1. Download the OBS Studio and install on your Mac.
  2. Upon opening for the first time, allow it to do the automatic configuration (i.e., I just let it set up all the defaults, and specified that I'd be using this for recording, rather than for streaming).
  3. I then added a new "Video Capture" in the Source box at the bottom, allowing it access to my Mac's webcam.  My face turns up in a little box in the OBS window, which I can resize and relocate as I see fit.
  4. I then experimented with adding a simple "Image" in the Source Box, again resizing to whatever dimensions I wanted.  But now came the tricky part - adding Powerpoint.
  5. In Powerpoint, click on "set up slide show" and make sure that "Browsed by an Individual" is checked.  This means that when you start displaying your slides, it will only occupy the window, rather than filling the whole screen.
  6. In OBS, you can then go to "add source", select the Powerpoint window, and resize the window to whatever works best for your presentation (i.e., it might occupy 60% of your screen, leaving room for your webcam).  
  7. If you have the Powerpoint window and the OBS window side by side, you can then advance the slide show easily whilst watching them change in the OBS window.
  8. Click on "Start Recording" and deliver your slide show, clicking on "Stop Recording" when you're done.  My recording was then saved as an MKV file under "Movies" on my Mac (you can change this in settings).  In OBS, go to "File > Remux Recording", choose the file you want to alter, click on "remux", and it'll generate an MP4 version of your MKV file.
  9. If you want to get really snazzy, then OBS has techniques for cutting the start and end (where you'll be fiddling with start/stop recording), and even introducing fades and titles.  But that's probably for the more advanced user.


Health warning - I haven't yet tried to record a full presentation yet, this is only at the experimentation phase...


Monday 27 April 2020

Virtual Conferences - Part II

The ongoing Coronavirus crisis has pushed several conferences into a hasty virtual version, with varying degrees of success.  As described in my previous post, there are opportunities to be inventive and imaginative, recognising the potential advantages of inclusivity and accessibility, and to offer something that people can participate in across the time zones.  So let's see what's currently on offer.

LPSC 2020 

LPSC was cancelled in early March, without enough time to shift to a virtual format for talks and posters.  Some virtual meetings were offered spanning topics of community interest (the planetary decadal survey, NASA townhalls, etc.), and a series of Virtual Early Career Planetary Networking Events are now underway, consisting of real-time online conferences via 'RingCentral' (3 slides, 5 minutes per presenter) that are hopefully being watched by prospective employers, and can then be shared online.  LPSC have provided hosting for e-posters, as has the Earth and Space Science Open Archive (ESSOAr), which is also used for the AGU.  

Leigh:  Despite the fact that you can then get a DOI for your contribution, there doesn't appear to have been a wide-scale uptake of this approach, as I don't see many papers on the archives.  I'm not sure how many people might actually be downloading and reading them, either, unless it was really close to my research area - it's not like browsing posters and chatting to authors in person.

EGU 2020

EGU (scheduled for early May) had more time to plan, so could be more ambitious. Using the #shareEGU20 hashtag, EGU runs for four days in May and became free to join, although uploads of presentation materials and commenting required authors and participants to have a Copernicus user account.  Abstracts had been submitted before the crisis, and charged a €40 abstract processing fee.  The conference would be entirely through uploaded "displays", comments on the presentations, and real-time text chats (08:30 to 18:00 CEST).  There would be no live presentations in the science sessions, nor video or audio chats.  Union symposia (one per day, 10:45-12:30 CEST), great debates, and some townhall meetings would be hosted through videoconferencing.

For scientific sessions, authors could upload presentations for a month before the meeting, then a dedicated, live, text-based chat for discussion would be held for the presentations of that session.  Presentations could have a variety of formats - PDFs or PPTs of the slides, or even mp4 files to record a video.  The important thing was that the appropriate Creative Commons License be included, and that presentation materials (and potentially comments) would remain online.  This shouldn't make any difference to future publication - most journals specifically allow posting on a (not-for-profit) preprint server prior to submission.  Journals allow, and usually encourage, that authors discuss their work at conferences prior to writing and submitting a manuscript.

Uploads of presentation materials were encouraged from 1 April to 31 May, and the same two-month period is valid for comments by the community and replies by the authors.  Then the May 4-8th session chats are in real time and are time-limited.  EGU opens one text-based chat channel per session linked in the online programme. The link becomes active 15 minutes prior to scheduled session start and disappears 30 minutes after the scheduled end of the session. All chat channels use the software sendbird run on servers of Amazon Web Services (AWS) located in Frankfurt/Main, Germany.  Chats are not recorded and archived. The posts are deleted after the session ends.  The text-based live chat neither involves live presentations, nor video or audio chats, in order to remain inclusive for all attendees.  All orals, posters, and PICO talks were converted to 'displays' that allow those who have submitted abstracts to upload presentation materials, opt in to commenting, and participate in a live text chat during the scheduled session time.

Leigh:  I set up a personal programme for the giant planet sessions, finding a large number of withdrawn abstracts or non-presented materials.  Even so, there were tonnes of talk titles, and I found little to motivate me to download and read each one.  There needs to be a bit of organisation, so that talks are assembled into sub-groups and themes, rather than big long lists of links.  

Those links I clicked on provided the full slide decks, but without someone talking me through the materials, I quickly lost interest.  I'd much rather listen to someone tell me the story, with the central narrative and rationale that you get in a talk, rather than just reading someone's slides.  I clicked through a few titles I was interested in, but there were no comments.  I'm interested to see how the text chats go.

AAS 2020

AAS were due to hold their 236th meeting in Madison in early June, and have switched to a 3-day version of their usual summer conference (slimmed down from 4 days).  The bulk of the meeting will be held in real time, restricted to those who register, and captured for later access by registrants who might have missed something in real time.  Recordings of the plenary talks will be made freely available to all AAS members.  Science sessions will be parallel 90-minute sessions of short talks arranged thematically, with iPoster (digital interactive) contributed posters and iPoster-Plus (presentations featuring short talks illustrated with iPosters), also arranged thematically.  There would still be press conferences, but they decided not to include splinter meetings.

AAS will be using Zoom Webinars (not Zoom Meetings) for science sessions and plenaries. A “host” and a small number of “participants” control the meeting and give the presentations, while the “attendees” (from dozens to hundreds) are not seen, heard, or able to control anything or share their screens. Attendees may ask questions and respond to polls initiated and controlled by the host or participants. I've seen iPosters presented at DPS meetings, where authors use standard templates to create a digital iPoster, which is then available online shortly before, during, and after the conference.  iPosters can include audio narration; high-resolution, zoomable images; videos and animations; and text with (or without) embedded hyperlinks. In addition, iPosters include a "chat" feature that allows someone viewing an iPoster to interact in real time with the author.

Leigh:  I really like the idea of the iPosters, and have seen these in action before.  Having the regular orals delivered realtime via webinars means a substantial inconvenience for anyone in a different time zone, but at least they will be recorded and so could be viewed later (by attendees at least).  Speakers will only be answering questions during the live sessions, but there can be virtual rooms after sessions to continue the conversation.

EAS 2020

The European Astronomical Society Annual Meeting (formerly known as EWASS) was due to be held in Leiden in late June, and has moved to an online meeting using a custom-built platform from their organisers, Kuoni.  It seems that registration fees are being refunded, but that the virtual meeting will charge a reduced fee (€80 for 5 days, €50 for one day).  According to their FAQ page, the meeting will still take place over 5 days, with some elements live, and some pre-recorded.  It looks like they'll also stick to the Central European time zone, just like AAS is sticking to the US time zone, making it a challenge for participants in time zones greatly removed.    For registered participants the presentations (platform and posters) will be made available after the meeting for a limited period of time (TBD).  They are aiming to use interaction options like chat, Q&A and live polling, and there will be ePoster sessions. 

Leigh:  The virtual EAS is still evolving, but also seems to be aiming to use the regular time slot for their meeting, rather than distributing it over a longer time period.  It'll be interesting to see how the real-time and asynchronous aspects of the conference blend together.

**This post is a work-in-progress, please check back!**

Thursday 23 April 2020

Uranus from Hubble

Tuesday 21 April 2020

Virtual Conferences - Part I

It's now been 6 weeks since I last stepped foot in my office.  6 weeks of trying to be productive from home, and it feels like a vast swathe of my working time has been spend on virtual meetings via Zoom, Skype, Teams, BlueJeans, Webex.... I've even taken the lead on a few.

They're not great - lots of hours spent in front of my computer (sometimes listening via my mobile phone), often at inconvenient hours because of differences in time zones, and usually wishing the speaker would've just summarised their thoughts in an email.

And now we're facing the prospect of some of the major planetary science conferences moving online, and it's abundantly clear that WE CAN'T EXPECT THIS TO BE BUSINESS AS USUAL.  There has to be a better way for doing this.  Thankfully, this is an issue that's already been considered by much more thoughtful people than me.

Benefits of Virtual Conferences

Here are some of the reasons why virtual conferencing really should become more frequent in the 21st century, even without global health crises preventing travel:
  • Climate, climate, climate:  The carbon footprint of academic departments is usually overwhelmed by researchers travelling across the world for meetings, and its time for a culture change if we're to do our bit.  I think it's fair to admit that some of this travel is unnecessary.
  • Work-life balance: how many weekends have been lost to travel, ready to start a meeting at 9am on a Monday?  Family life disrupted because of the need to start at the beginning of the "working week?"  
  • Inclusivity:  How many members of our community are we missing because of parental and other carer responsibilities?  How many voices are absent because travel poses extreme challenges, financially, physically, or mentally?  Shifting online might open the door to a more inclusive conference.
  • Less time wasted on "marginally-useful" meetings: We all know them - the meetings we felt we had to show our faces at, even though we didn't have a lot to contribute, and didn't learn a lot as a result.  FOMO - fear of missing out - often drives us to attend.  Now we can attend them virtually, and possibly even multi-task to get other things done at the same time.   

Problems with Virtual Conferences

Here are some common problems with virtual meetings, some easier to solve than others:
  • Stifled Discussions:  Virtual conferences are great as a one-way flow of information, either as live talks or pre-recorded presentations.  But new collaborations and ideas often stem from the more informal coffees, lunches, poster sessions, and chance encounters.  These casual "in-person" chats are currently hard (but not impossible) to replicate in the virtual world, and lack the "spontaneity" of people meeting in the same physical location.  There's also the question of the lack of human contact, where in-person conferences might be the highlight for those working in isolation.
  • Multiple time zones:  My work is very Europe/US focussed, meaning lots of late-afternoon and evening meetings.  The idea of running an 8-hour conference day virtually is just a nonsense - no one is working at their best under those circumstances, and I personally struggle to keep my brain going late in the evening.  Not to mention those colleagues trying to follow from the east, in the middle of the night...  so: make one-way information delivery (i.e., talks) available to watch during preferred timezones, and keep discussion meetings for a mutually-convenient (and shorter) time slot.
  • Lost voices:  Raising your hand in a big meeting can sometimes be nerve-wracking.  Doing it online, when you're not sure who is listening, and in the absence of virtual cues to know how they're responding to your question (rolling their eyes, or wide-eyed astonishment), it can be extremely daunting.  We need a way to make all participants comfortable and willing to contribute.
  • Loud voices:  In the same vein, some speakers will dominate the Q&A and discussion,  overwhelming everyone else, and hogging all the precious time.  A strong moderator, able to recognise and involve everyone, is a must for inclusive virtual conferences.
  • Can you hear me now?  I was on mute... You can play conference bingo, with phrases like this on almost every meeting.  The technology is getting better and better, but often relies on the skills of the users - we shouldn't assume that all participants have good microphones, good cameras, quiet environments conducive to chats, sufficient broadband to connect, or know how to share a screen, presentation, or virtual whiteboard.  
  • Promotion and career progression:  Standing on stage and delivering your first conference talk is a tremendously nerve-wracking experience, but can open doors to future jobs and collaborations.  Early-career researchers rely on conference networking for opportunities, mid-career researchers need keynote and invited presentations for promotion, and the virtual world is hard-pushed to deliver this.  UCSB professor Ken Hiltner describes this as "present or perish."
  • The art of presentation:  I've given short lectures via web conference, and they're hard - when I'm in front of an audience, I try to read the energy, knowing when to ramp up enthusiasm to keep people going, or when to go back over a concept because of blank, horrified faces.  You play to the crowd.  You don't get that sat alone at your desk.  But that's a small price to pay.
PS:  Trying to blend virtual conferences and in-person meetings together invariably leads to problems.  It's a nightmare dialling in to a meeting when the room is full of people talking to one another.  Far better to go all-or-nothing, and to have everyone participating remotely so that they're on an equal footing!

Another Way...


Virtual conferences will probably never replicate the face-to-face interactions that we're used to.  However, the COVID-19 crisis is, by necessity, leading to innovation in virtual conferencing, but this is a challenge that was already being considered as part of the nearly carbon-neutral (NCN) conference model.  That helpful guide suggests:
  1. Speakers pre-record their conference presentations for hosting on a conference website (which can be as simple as a Wordpress site) so that they may be viewed at any time (i.e., removing the real-time requirement), giving the viewer time to think and come up with questions.  Pre-recorded videos can also be better-rehearsed and polished, and also closed-captioned (in multiple languages) for greater accessibility.
  2. A shared online Q&A session (organised into themed sub-panels) over 2-3 weeks, with written questions and answers, where the members of a panel respond to audience queries.  Eliminating the "live Q&A" and making them "asynchronous" means that the problem of multiple time zones is removed, and removing the pressure of "on-stage" questions might allow more time to think and develop robust answers.  Breakout sessions on specific themes could also be organised.
  3. Archive of content (talks and Q&A transcripts) after the conference, open access across the globe.  This one I worry about a little - sometimes conference talks are used to present data before publication/peer-review, and authors may be reluctant to risk any (social) media coverage ahead of key publications.  Maybe a "do not cite" or a time-limited shelf life could be incorporated?
I particularly like this paragraph on Hiltner's website: "Such events can result in far more efficient use of a conference goer’s time, as one can quickly scan through the text of a talk or a Q&A session for material of interest. Consequently, this NCN approach allows us to listen to all the talks of interest to us – and none of those that are not – in the order, and at a time, of our choosing"

Hiltner encourages conference organisers to experiment with this scheme, and I personally feel that a blend of pre-recorded talks (sometimes called "asynchronous" content), real-time live discussion ("synchronous"content), and Q&A might be the right combination of flavours, and I hope that our planetary-science conferences (DPS, EPSC, AGU, EGU, LPSC, COSPAR) find a balance.  Tanja de Bie of the Leiden Centre for Innovation also has a handy run-down of remote conference pros, cons, and suggestions. 

And the ACM guide for virtual conferences provides a low-overhead virtual conference:  "First, ask authors to pre-record their talks and upload the videos to YouTube. Link those video from the conference website. This involves very low overhead on the part of the conference organizers, as they do not have to deal with supporting the live presentation of all these talks. Additionally, set up a few synchronous sessions for Q&A with groups of authors and panels using one of the videoconferencing and/or Webinar systems (e.g., Zoom). Consider also setting up a Slack workspace for participants to chat before, during, and after the live sessions. The links to the live sessions can be disseminated in Slack."

In particular for planetary science, there's an opportunity for short, focussed sub-meetings (i.e., a week-long meeting on one topic), eliminating the nightmare of overlapping parallel sessions that plague the major meetings.  Why be constrained to a single week?  Why not have the conference over a month, spreading out the themes?  I think you still need to make it "an event" over a limited time period, so it doesn't just feel like a series of talks on a website.  Provided everyone is in the same boat, why not have regional hubs, so some people could meet in person to watch presentations and hold panels?

In Part II of this post, I'll try to look at some examples of virtual conferences being held in 2020, to explore the pros and cons....

Resources:


Friday 20 March 2020

Isolation

This week has been a long year.

It's Friday March 20th 2020, and if the world had been anywhere close to normal, I would have been hurtling down a white water rapid with old friends on a stag party today, before enjoying a night out on the town.  But like a hundred million other social engagements, that's all been brought to an earth-shattering halt by a global public health crisis.

Last Sunday I started to experience griping stomach pains, which I initially put down to some dodgy food the night before (I'd been foolishly left in charge of the cooking).  But by that evening, I was unable to get warm, sat shivering in a dressing gown on the sofa whilst the kids got prepped for the school week ahead.  A blue lump of clammy awfulness.  Fever raged all night, and I knew I had a problem the next morning - headaches, chills like ice, and moments of intense heat and dehydration.  I'd been expected in the office to examine 3rd-year physics projects Monday afternoon, and it has to be damned serious for me to let people down.  But that's what I had to do, sending a series of apologetic cancellation emails Monday morning (including to my fellow stag party members), before collapsing on the sofa that afternoon.

Monday evening, the UK brought in new guidance requiring all household members to self-isolate for 14 days, if even one person shows any symptoms of COVID-19, including high fever and a continuous new cough.  My kids were disappointed to be missing their school friends - my daughter especially so, as she'd been practising for the school production.  Soon enough though, that too was cancelled.  So from Tuesday, the four of us were in self-isolation for two weeks.

The fever lasted through Monday night and into Tuesday, probably around 36 hours in total.  When it finally broke, I tried to get some work done, but the griping stomach pains continued into the next day too, doubling me over in pain.  I spoke to the NHS 111 line (who essentially read me everything I'd already read online, but couldn't advise any further), who put me onto a GP for reassurance and recommended some over-the-counter medication, which some kind neighbours picked up for us and left at our door.  These helped, but by Wednesday afternoon the illness provided a second sting, as the fever returned with a vengeance - and once again I was in bed with high temperature and dehydration.  Now 72 hours in.

Thankfully the fever had broken by Thursday morning, and the stomach pains greatly diminished.  I'm left with a mild dry cough and a strange sensation of being an asthmatic, with slightly troubled breathing, particularly when climbing stairs.  All this for a reasonably healthy 38-year-old.

Now, all this sounds suspiciously like the symptoms of COVID-19 to me.  I rarely get colds, I don't remember the last time I ever had flu-like symptoms, and I find the chances of it happening during the same week as a global pandemic escalation all a little suspicious.  But clearly not impossible.  So, for overseas readers, you might be wondering why I don't just get tested?  That's because the lacklustre and (some might say) irresponsible responses of the UK government has been not to test the wider population, focussing only on hospitals.  Not only does this mean that the numbers of infections you've been reading about are nonsense, but also that it's going to be near-impossible to track the spread of this disease.  Plus, it means I can't know whether I'm now immune, nor whether my family are all self-isolating for no reason.  In short: the UK needs to step up its testing as a matter of urgency.

If it is COVID-19, where might I have caught this from?  Up until Tuesday 10th March I'd been working from the office, commuting to work every day by train, and interacting with the students.  I started home working on the Wednesday out of an abundance of caution, but I'm so glad I did, as it limited my contact during the potential 5 days of being asymptomatic, before my fever started on Sunday.  One superb reason why people should be taking the social distancing guidelines seriously.

A lot has changed in a week - schools all closed yesterday.  University of Leicester brought forward end of term to today.  I've had all future meetings cancelled or postponed.  Weddings put off to future, happier times.  My diary is empty.  They've ordered all the pubs closed.  My wife is a key worker, so I'm facing the prospect of home schooling for at least part of each week for months to come, meaning productivity will drop to somewhere near zero.  But all of these are nothing compared to what some are about to go through.  I've been touched by the kindness and generosity of our friends and family while we've been self-isolating - we'll all need so much more of this if we're to cope with the dark times ahead.

And finally, permit me to be blunt and angry for a moment:  to the cretins and morons who are selfishly stockpiling or flouting the guidelines on social distancing, stop.  Just stop.  Your stupidity could have catastrophic consequences for all of us, and particularly the most vulnerable in our society.  I hope your victims have the opportunity to forgive you.

Good luck everyone, stay healthy, and stay kind.


Wednesday 26 February 2020

Examining Ice Giants With NASA’s Webb Telescope

From a NASA/Goddard press release on February 26th 2020, covering our Guaranteed Time Observations of Uranus and Neptune:

Credits: NASA, ESA, and M. Showalter (SETI Institute); Right: NASA, ESA, L. Sromovsky and P. Fry (U. Wisconsin), H. Hammel (Space Science Institute), and K. Rages (SETI Institute)


Far-flung Uranus and Neptune — the ice giants of our solar system — are as mysterious as they are distant. Soon after its launch in 2021, NASA’s James Webb Space Telescope will change that by unlocking secrets of the atmospheres of both planets.

The cold and remote giant planets Uranus and Neptune are nicknamed the “ice giants” because their interiors are compositionally different from Jupiter and Saturn, which are richer in hydrogen and helium, and are known as the “gas giants.” The ice giants are also much smaller than their gaseous cousins, being intermediate in size between terrestrial planets and the gas giants.  They represent the least-explored category of planet in our solar system.  Scientists using Webb plan to study the circulation patterns, chemistry and weather of Uranus and Neptune in a way only Webb can.

“The key thing that Webb can do that is very, very difficult to accomplish from any other facility is map their atmospheric temperature and chemical structure,” explained the studies’ leader, Leigh Fletcher, an associate professor of planetary science at the University of Leicester in the United Kingdom. “We think that the weather and climate of the ice giants are going to have a fundamentally different character compared to the gas giants. That’s partly because they’re so far away from the Sun, they’re smaller in size and rotate faster on their axes, but also because the blend of gases and the amount of atmospheric mixing is very different compared with Jupiter and Saturn.”

All the gases in the upper atmospheres of Uranus and Neptune have unique chemical fingerprints that Webb can detect. Crucially, Webb can distinguish one chemical from another.  If these chemicals are being produced by sunlight interacting with the atmosphere, or if they’re being redistributed from place to place by large-scale circulation patterns, Webb will be able to see that.

These studies will be conducted through a Guaranteed Time Observations (GTO) program of the solar system led by Heidi Hammel, a planetary scientist and Webb Interdisciplinary Scientist. She is also Vice President for Science at the Association of Universities for Research in Astronomy (AURA) in Washington, D.C. Hammel’s program will demonstrate the capabilities of Webb for observing solar system objects and exercise some of Webb’s specific techniques for objects that are bright and/or are moving in the sky.

Uranus: The Tilted Planet

Unlike the other planets in our solar system, Uranus — along with its rings and moons — is tipped on its side, rotating at roughly a 90-degree angle from the plane of its orbit. This makes the planet appear to roll like a ball around the Sun. That weird orientation — which may be the result of a gargantuan collision with another massive protoplanet early in the formation of the solar system — gives rise to extreme seasons on Uranus.

When NASA’s Voyager 2 spacecraft flew by Uranus in 1986, one pole was pointing directly at the Sun.  “No matter how much Uranus would spin,” Hammel explained, “one half was in complete sunlight all the time, and the other half was in total darkness. It’s the craziest thing you can imagine.”

Disappointingly, Voyager 2 saw only a billiard-ball smooth planet covered in haze, with only a scant handful of clouds. But when Hubble viewed Uranus in the early 2000s, the planet had traveled a quarter of the way around in its orbit. Now the equator was pointed at the Sun, and the entire planet was illuminated over the course of a Uranian day.

“Theory told us nothing would change,” said Hammel, “But the reality was that Uranus started sprouting up all kinds of bright clouds, and a dark spot was discovered by Hubble. The clouds seemed to be changing dramatically in response to the immediate change in sunlight as the planet traveled around the Sun.”

As the planet continues its slow orbital trek, it will point its other pole at the Sun in 2028.

Webb will give insight into the powerful seasonal forces driving the formation of its clouds and weather, and how this is changing with time. It will help determine how energy flows and is transported through the Uranian atmosphere. Scientists want to watch Uranus throughout Webb’s life, to build up a timeline of how the atmosphere responds to the extreme seasons. That will help them understand why this planet’s atmosphere seems to go through periods of intense activity punctuated by moments of calm.

Neptune: A World of Supersonic Winds

Neptune is a dark, cold world, yet it is whipped by supersonic winds that can reach up 1,500 miles per hour. More than 30 times as far from the Sun as Earth, Neptune is the only planet in our solar system not visible to the naked eye. Its existence was predicted by mathematics before its discovery in 1846. In 2011, Neptune completed its first 165-year orbit since its discovery.

Like Uranus, this ice giant’s very deep atmosphere is made of a thick soup of water, ammonia, hydrogen sulfide and methane over an unknown and inaccessible interior. The accessible upper layers of the atmosphere are made of hydrogen, helium and methane. As with Uranus, the methane gives Neptune its blue color, but some still-mysterious atmospheric chemistry makes Neptune’s blue a bit more striking than that of Uranus.

“It’s the same question here: How does energy flow and how is it transported through a planetary atmosphere?” explained Fletcher. “But in this case, unlike Uranus, the planet has a strong internal heat source. That heat source generates some of the most powerful winds and the most short-lived atmospheric vortices and cloud features of anywhere in the solar system. If we look at Neptune from night to night, its face is always shifting and changing as these clouds are stretched and pulled and manipulated by the underlying wind field.”

Following the 1989 Voyager 2 flyby of Neptune, scientists discovered a bright, hot vortex — a storm — at the planet’s south pole. Because the temperature there is higher than everywhere else in the atmosphere, this region is likely associated with some unique chemistry. Webb’s sensitivity will allow scientists to understand the unusual chemical environment within that polar vortex.

Just the Beginning

Fletcher advises to be prepared for seeing phenomena on Uranus and Neptune that are totally unlike what we’ve witnessed in the past. “Webb really has the capability to see the ice giants in a whole new light.  But to understand the continual atmospheric processes that are shaping these giant planets, you really need more than just a couple of samples,” he said. “So we compare Jupiter to Saturn to Uranus to Neptune, and by that, we build up a wider picture of how atmospheres work in general. This is the beginning of understanding how these worlds are changing with time.”

Hammel added, “We now know of hundreds of exoplanets — planets around other stars — of the size of our local ice giants. Uranus and Neptune provide us ground truth for studies of these newly discovered worlds.”

The James Webb Space Telescope will be the world’s premier space science observatory when it launches in 2021. Webb will solve mysteries in our solar system, look beyond to distant worlds around other stars, and probe the mysterious structures and origins of our universe and our place in it. Webb is an international program led by NASA with its partners, ESA (European Space Agency) and the Canadian Space Agency.

For more information about Webb, visit www.nasa.gov/webb.

Rob Gutro
NASA's Goddard Space Flight Center, Greenbelt, Md.
301-286-4044
robert.j.gutro@nasa.gov

Ann Jenkins / Christine Pulliam
Space Telescope Science Institute, Baltimore
410-338-4488 / 410-338-4366
jenkins@stsci.edu / cpulliam@stsci.edu

Last Updated: Feb. 26, 2020
Editor: Rob Garner