Thursday, 9 October 2014

Q&A: Jupiter's Great Red Spot

1. When was the GRS first observed and what were its dimensions at this time, please?

John Roger’s excellent book has the history of the GRS:  it its likely that it’s not the same spot as observed in the 17th century by Cassini, but the first definitive observations of ‘our’ GRS came in the 19th century - observers started to draw the ‘hollow’ around the GRS in 1831.  The vortex within the hollow seemed to come and go with time, until the 1870s when observers first started to draw a large red oval within the hollow.  It covered about 34 degrees of longitude between 1879 and 1882.


2. What are its dimensions today?

Hubble images in 2014 showed the GRS to be about 10,000 miles in east-west distance.  See the press release by  Simon et al. : http://www.nasa.gov/press/2014/may/nasas-hubble-shows-jupiters-great-red-spot-is-smaller-than-ever-measured/#.VCz_Ri5dVR4


3. Would it be fair to say that the GRS consists mostly of hydrogen gas with a colossal cloud – mainly ammonia ice, plus something, probably phosphorus, making it reddish?

Well, hydrogen and helium are everywhere on the giant planet, so that does’t really distinguish it from the rest of the atmosphere.  Instead, the GRS is a region of unusual clouds and chemicals, entrained by a peripheral collar of winds rotating anticlockwise.  The composition of those clouds are largely unknown, but likely to be a combination of nitrogen, sulphur and phosphorus compounds and ices, possibly coated in hydrocarbons (and possibly nitriles) raining down from above. The source of the red colour remains a mystery - the compound has to be strongly blue absorbing, but it’s identify is unknown.  Read my blog about it here: http://planetaryweather.blogspot.co.uk/2014/01/what-gives-jupiter-its-colourful-stripes.html


4. Would it also be correct to say that the revolving storm is stirred by the planet’s rotation and that it has raged for more than three centuries?

The formation of vortices is certainly related to the rapid rotation of the planet, as eddies are spawned by the unstable jets, interact and merge to provide energy to continually power the GRS.  It’s longevity is unclear - it’s been there since at least the nineteenth century, and there’s the suggestion that large storms might be commonplace in this region of Jupiter’s atmosphere.  I.e., if our GRS eventually dissipates, maybe another will form at a similar latitude.


5. Has the GRS always been oval shaped? And has it always been wider across (ie from east to west) rather than "higher" (ie from north to south)?

The early observations show a very elongated oval, which is shrinking steadily in east west extent.  The shrinkage has been known for years, but amateur and professional data suggest that it’s now accelerating rapidly.


6. Is the GRS showing signs of becoming more circular?

That’s certainly what it looks like!


7. There have been some suggestions that the anticyclone storm is shrinking at the rate of about 1000 kilometres a year. Is this correct?

Not according to the Hubble and Voyager measurements, which show a decrease from 14,500 miles in 1979 to 10,250 miles in 2014.


8. If the shrinkage continued at this rate, does this imply that the GRS would have disappeared by the year 2030, or thereabouts, please?

That’s very hard to say, as it depends on the reason why the GRS is shrinking, and whether any particular aspect ratios (i.e., ovals or circles) are more stable than others.  We certainly live in an interesting time.


9. Lastly, is it conceivable that the shrinkage will stop at some stage and perhaps start increasing in size again?

Absolutely.  If the GRS is maintained by swallowing up smaller storms and eddies that have the misfortune to be at the same latitude, then large storms (such as those seen in 2010-11 when Jupiter’s faded SEB revived) could feed more energy into the GRS  and help it to grow again. We’ll have to watch what’s going on very carefully.

Friday, 29 August 2014

Missions to the Ice Giants

The past several years has seen a resurgence in interest in exploration of Uranus and Neptune as the next logical step in the exploration of the Outer Solar System.  In the USA, NASA's 2009 planetary decadal survey ranked Uranus as a high priority (following Mars and Europa) for a future flagship class mission, despite the low likelihood of billion-dollar missions in NASA's present roadmap.  In Europe, teams of scientists have proposed Uranus missions as part of the 2010 Cosmic Vision call for Medium-class missions (Uranus Pathfinder for M3) and the 2013 call for Large-class mission science themes (L2 and L3 launch slots).  Although none of these mission concepts have been accepted to date, they have served to raise the profile of the ice giants as key destinations for future exploration, ticking all the right boxes within ESA's Cosmic Vision programme.  The momentum has been maintained on both sides of the Atlantic via international workshops (Paris 2013 and Maryland 2014) dedicated to the exploration of the ice giants.  And with the recent announcement of opportunity for ESA Medium class missions (M4) for launch in 2025, there's never been a better time to consider the merits of exploring the ice giants.

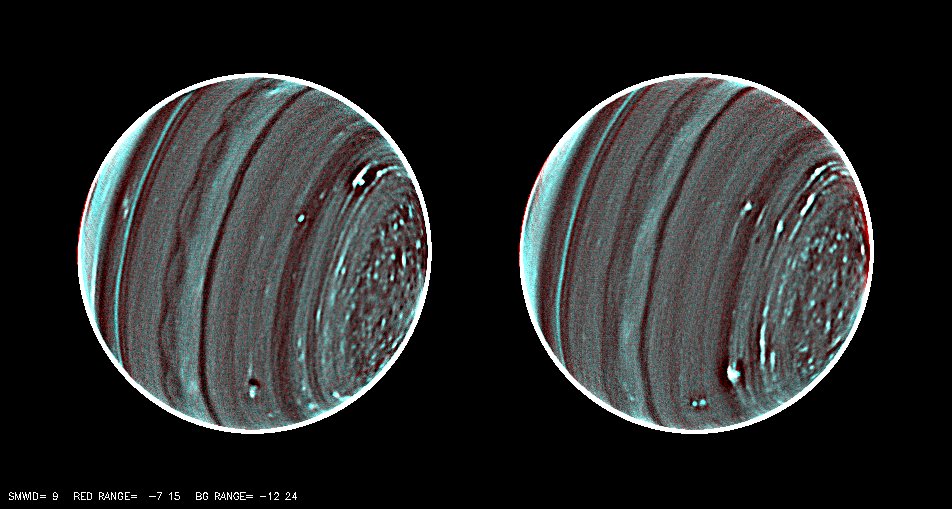
Uranus as seen by Keck in 2012, via the Planetary Society:
Credit; NASA / ESA / L. A. Sromovsky / P. M. Fry / H. B. Hammel
 I. de Pater / K. A. Rages
Exploration of Uranus and Neptune is a gaping hole in our current exploration of the solar system, having been visited only once by Voyager 2 in the late 1980s.  This was just a flyby mission, compared to the detailed orbital reconnaissance of Jupiter (Galileo, Juno and the upcoming ESA JUICE mission) and Saturn (Cassini).  Although Voyager 2 made history, and provided humankinds' first close-up views of these distant worlds, that's now been a quarter-century ago, using technology developed in the 1970s.  Even if construction of a new mission began today, it's likely that half a century will have gone by since the heady days of the Voyager flybys before we arrive at Uranus or Neptune.  Just imagine what we could accomplish with a sophisticated 21st-century spacecraft, orbiting these worlds for the first time!

But why bother with these distant balls of gas?  That's a question that comes up so often I'm trying to organise my thoughts into compelling reasons, heavily biased towards my atmospheric science perspective.  Below I don't even mention their bizarre magnetospheres (completely tilted by 50-60 degrees from the rotation axes), diverse satellite systems and unusual rings, which serve to make them even more compelling destinations.

1.  What makes the Ice Giants special, and different from the Gas Giants?
Some of the latest surveys of exoplanetary systems seem to suggest that planets of Uranus/Neptune size (i.e., 14-18 Earth masses and around 4 Earth radii) might be commonplace, the missing link between the larger gaseous worlds like Jupiter and Saturn and the smaller terrestrial worlds (Earth and Super-Earth sized planets).  If that turns out to be true, once observational bias in the exoplanet samples are resolved, then we might have two great examples of the most common planetary type here in our own solar system.  The major difference between the two categories (gas and ice giant) are caused by their origins - by forming more slowly in the distant solar system, the ice giants couldn't suck up as much of the primordial hydrogen and helium as the gas giants, making them smaller and relatively more enriched in heavy elements.

Their size, rotation (16-17 hours), composition and low temperatures then account for the broad observational differences - blue colours due to long paths through red-absorbing methane gas; fewer zonal jet streams and cloud outbursts than their giant planet cousins (mainly one westward jet at the equator and a prograde jet encircling each pole), etc.  But this is a very basic picture, and any future mission would hope to construct a full three-dimensional understanding of an ice giant atmosphere, from the tenuous thermosphere down to the cloud decks of ices (methane, ammonia, etc.) and into the deeper interior, to test our understanding of the physics and chemistry of planetary atmospheres under these extreme conditions.
Neptune from Voyager 2, from the Planetary Society Blog,
with credit to NASA / JPL / Björn Jónsson 


2. Why do Uranus and Neptune appear so different, despite their shared origins?
If Uranus and Neptune formed at about the same time in the solar nebula, at about the same temperatures, accreting material from the same icy reservoirs and then undergoing the same thermal evolution, why do they look so different today?  Neptune has some of the most powerful winds in the solar system, with cloud features shifting and evolving over hourly timescales, despite its great distance (30AU) from the Sun.  Uranus, on the other hand, appears sluggish most of the time, with the occasional convective outburst that can be seen punching through the overlying hazes that cause the blue-green fuzzball appearance in visible light.  Neptune has an 'Earth-like' axial tilt subjecting it to 'normal' seasons over its 165-year orbit (summer solstice was in 2005), whereas Uranus has been completely bowled over onto its side, moving on its 84-year orbit like a spinning top on its side.  From the atmospheric science perspective, Uranus really is the oddball of the solar system, rotating on its side so that its poles are subjected to 42 years of summer sunlight then 42 years of winter darkness (the last equinox was in 2007).  That should set up the most extreme seasonal changes of any planet in our solar system, but we don’t really have a good understanding of how the atmosphere responds to those vast changes in sunlight.  Maybe some cataclysmic event deep in Uranus' past, such as a collision with another forming planet, completely bowled the planet over onto its side.

Can such an event explain the fact that Uranus is so sluggish, whereas distant Neptune is so active?  Maybe.  All the giants glow in infrared light, emitting more heat energy than the light they receive from the Sun.  They have their own internal heat, powered by slow gravitational contraction and possibly helium settling on Jupiter and Saturn.  But Uranus has no heat source that we can detect.  So is there something weird about the interior and atmosphere that prevents broad convection, and traps that old heat inside?  Or was all the heat lost catastrophically, maybe connected to whatever cataclysmic impact knocked the ice giant over onto its side?  Again, Uranus’ lack of internal energy makes it stand out as one of the strangest targets in our solar system from an atmospheric perspective, and maybe that’s why we see so few discrete clouds and storms.  Neptune, on the other hand, has the strongest internal heat of any giant planet, so this is likely powering the meteorology with only a small amount of help from the Sun.  It is these stark differences between the two ice giants, despite their similar composition and origin, that make them so tantalising.

3.  What can the ice giants tell us about the evolution of the outer solar system?
Due to their vast size, the giant planets lock away the fingerprints of formation in their chemical soup.  Once the gases, ices and rocks are accreted by the forming planets, they find it rather hard to escape again, being forever locked away in the planets we know today.  Of course, there might be significant reprocessing of the material - heavier stuff settling downwards to potentially form a core; chemical reactions and cloud formation locking certain species away.  But the bulk composition still contains the balance of elements and isotopes that must have been present in the solar system 4.5 billion years ago.  Simply put, comparisons of giant planet composition can help us understand how they formed and evolved.  But precise comparisons need accurate measurements, and we only really have that from Jupiter's Galileo probe in 1995.  A probe entering an ice giant world to sniff out the chemical composition (particularly water, Nobel gases and the carbon, sulphur and nitrogen chemicals below the main cloud decks) would provide a paradigm shift in the understanding of these worlds.  Hopefully any future mission to orbit an ice giant would take an entry probe along with it.

Uranus through the wavelengths, showing the capabilities of a sophisticated orbiter.

So think of Uranus and Neptune as the missing links, helping us to explain the story of our own solar system, and connect us to the most common types of planets throughout our galaxy.

Further Reading:


Monday, 25 August 2014

Uranus on BBC Future

Back at the beginning of August, Chris Arridge and I were contacted by Richard Hollingham, a science journalist and presenter of the Space Boffins podcast.  He wanted to write an article on the renewed interest in the exploration of Uranus, and here's the result (although a shame they couldn't include some of the great Voyager or ground-based images of the planet!).

http://www.bbc.com/future/story/20140822-the-mission-to-an-un-loved-planet

Friday, 1 August 2014

The Evolution and Fate of Saturn’s Stratospheric Vortex

As I was preparing for a presentation on Saturn's seasonal atmosphere in Wisconsin, I managed to track down a transcript of my 2012 presentation to the DPS.  These talks are so short that I tend to write down the key points in advance to make sure I don't miss anything.  As we're now seeing the demise of this large stratospheric anticyclone in 2013-14, I thought it'd be interesting to reproduce here.  It summarises the results of the following paper:

Leigh N. Fletcher, B.E. Hesman, R.K. Achterberg, P.G.J. Irwin, G. Bjoraker, N. Gorius, J. Hurley, J. Sinclair, G.S. Orton, J. Legarreta, E. García-Melendo, A. Sánchez-Lavega, P.L. Read, A.A. Simon-Miller, F.M. Flasar (2012), The Origin and Evolution of Saturn’s 2011-2012 Stratospheric Vortex, Icarus, Volume 221, Issue 2, Pages 560–586, (http://dx.doi.org/10.1016/j.icarus.2012.08.024)

DPS Reno, October 2012:

As we speak, the warm stratospheric vortex that developed in Saturn’s northern stratosphere in the aftermath of the 2010-2011 springtime storm is still persisting.  This presentation will summarise our understanding of conditions within the vortex and its long-term evolution. 

Reflected sunlight observations documented the evolution of the convective storm activity in Saturn’s northern mid-latitudes, which abated in July 2011.  Early in 2011 we first noted that the churning tropospheric storm had perturbed stratospheric winds, temperatures and composition, generating two regions of elevated temperatures to the east and west of the initial disturbance (phase 1).  These two beacons moved west at different velocities (one directly above the bulbous white storm head) until late April 2011 when they merged (phase 2), became disassociated with the storm head, and formed the single large beacon complex which is still present, and decaying (phase 3 and 4), at the present time.  The beacon continues to move west around the planet like clockwork at approximately 31 m/s, and appears disassociated from anything observed in the troposphere.

Conditions within the Vortex

So what do we know about the beacon?  Thermal imaging and spectroscopy from Cassini, VLT and IRTF have been used to monitor conditions within the vortex from pre-merger to the decay phase.  We know that the vortex exhibits peak temperatures at 2 mbar (deeper down than the original two beacons which were centred at 0.5 mbar), but has extended regions of hot emission stretching around the planet at even higher altitudes where the shape is less well-defined.  Using the thermal windshear relations to extrapolate zonal and meridional winds from the tropospheric cloud decks into the stratosphere, we know that the vortex is bounded by a peripheral anticyclonic jet (i.e., clockwise motion) which determines the width of the feature, which was some 80 degrees wide at its maximum extent but is now shrinking.  This jet entrains unique chemistry, with acetylene and other species enhanced within the vortex, suggestive of atmospheric subsidence.  From studying VIMS, ISS and amateur imaging, we know that the vortex has no tropospheric counterparts.

Evolution of the Vortex in 2011-2012

Full spatio-spectral maps of the northern hemisphere were acquired by Cassini during the decay phase, showing how the vortex has begun to cool and shrink in longitudinal extent over the observational period.   These plots show the 2-mbar temperatures and the magnitude of the peripheral winds.  The chart on the right shows that the shrinking is at a rate of approximately 0.16 deg/day, with the peak velocities of the peripheral jet moving inwards to its current longitudinal extent of around 30 degrees, hence the vortex has effectively circularised.  Acetylene remains entrained within the vortex, but the abundance is now decreasing.  At these rates, we’d expect the vortex to dissipate in the next 12-18 months.

Wave Origins

So far we’ve discussed the evolution and fate of this bizarre feature, but how did it develop in the first place?  Large scale weather disturbances on Earth are the sources of strong wave perturbations, from small-scale gravity waves to planetary-scale Rossby waves, thus it is reasonable to suggest that waves emitted by the tropospheric storm carried energy and momentum into the stratosphere.  How and where that energy was deposited, and why we saw the spin-up to produce anticyclonic vortices, requires more detailed models.  

The transmissivity of the atmosphere to waves depends on the details of the zonal wind structure.  However, simply assuming a quasigeostrophic atmosphere with no vertical shear of the zonal winds, we find that the conditions for the vertical propagation of Rossby waves to transport energy upwards (the difference between the ambient zonal velocity and the wave phase speed, u-c, must be positive and less than some critical prograde velocity, Uc) of this particular dimension (defined by the wavenumbers k, l and m in this expression) is only satisfied near the first two retrograde jets.  This simple idea would prevent the emergence of a stratospheric beacon if a storm erupted at any other latitude.  

Things aren’t that simple, however, as Saturn’s winds vary with both height and with season.  Terrestrial planetary wave propagation is seasonally-dependent.  By using the radiative-climate model of Saturn’s atmosphere from Tommy Greathouse to provide a first-order estimate of the seasonal temperature gradients, we see that Saturn’s stratosphere should experience summer easterlies and winter westerlies just as on Earth.  Furthermore, taking Cassini/CIRS temperature maps since 2004 and computing the zonal winds at 2 mbar, we start to see hints that the winds are becoming more retrograde in northern spring and more prograde in southern autumn.  Crucially, the winds currently measured at 2 mbar at 40N are sufficient to satisfy the condition for Rossby wave propagation.

Conclusion

In conclusion, the springtime tropospheric storm caused the formation and evolution of a large, hot stratospheric anticyclone, which is slowly shrinking and cooling but is still present nearly two years after the eruption.  Seasonal conditions (transitioning from winter prograde to summer retrograde) may have been ideal at mid latitudes for Rossby wave transport of energy into the stratosphere from the storm clouds below.  Dynamical and chemical modelling of the stratospheric response to this tropospheric forcing is now required, and as Saturn’s storm season may not yet be over, detailed observations are needed to see whether another Saturnian storm can have a similar stratospheric aftermath.

Friday, 4 July 2014

A Decade of Oxford Science in the Saturn System

This month, Oxford scientists are celebrating ten years of scientific exploration by the Cassini-Huygens mission, a joint NASA-ESA ‘flagship’ mission to explore the gas giant Saturn, its rings and diverse satellite system.  Cassini has revealed many wonders in the outer solar system, from the hydrocarbon seas of Titan to the erupting plumes of Enceladus and the swirling storms of Saturn, and more is still to come as this sophisticated robotic spacecraft continues its lonely orbits a billion kilometres from home.  Here's a version of a news article written for Oxford's Physics news website:

The CIRS focal plane assembly, aligned within
the Space View Chamber in the clean rooms of
Oxford AOPP.
Researchers from Oxford’s Atmospheric, Oceanic and Planetary Physics sub-department have been part of the Cassini mission since the late 1980s, when work began to develop hardware components for the Composite Infrared Spectrometer (CIRS) in partnership with NASA’s Goddard Spaceflight Center. CIRS is an interferometer, a sensitive device that measures the spectrum of infrared light emitted from planetary atmospheres and surfaces, providing precise measurements of their temperatures and composition.   Through the early 1990s, Oxford’s space instrumentation group contributed to the instrument design and fabrication, including a cooler to maintain the low-temperatures needed to detect the weak infrared emission from bodies in the Saturn system, and the assembly to hold the detectors that make up the focal plane.   The engineering models for these systems are still held at Oxford Physics, compared with their counterparts mounted on the spacecraft in the frigid outer solar system.  Today, Oxford’s planetary group continues to provide CIRS observation planning and operations support; hosts the UK data mirror for processing of the returned data; and takes a leading role in the scientific analysis of the infrared observations.
The Cassini instrument, with the Oxford-designed
cooler on the right hand side.

Cassini-Huygens launched in 1997, and after a seven-year cruise (visiting Venus and Jupiter along the way) arrived in Saturn orbit in 2004 for a nominal mission lifetime of 4 years.  As a testament to the robust engineering and design of the Cassini hardware, CIRS is still going strong a decade later, providing Oxford researchers with a unique opportunity to explore the workings of a giant planet.  Furthermore, the longevity of the mission has allowed us to monitor evolving atmospheric conditions with season, as Saturn has moved from the depths of northern winter in 2004 into the northern spring sunlight of 2014 (Saturn takes 30-earth years to orbit the Sun, so Cassini has been observing for a third of a Saturnian year).  By the end of the mission in 2017, Saturn will have reached the northern summer solstice, allowing it to study the giant planet system during every season.

The hot polar cyclone and hexagonal wave
at Saturn's northern winter pole,
Fletcher et al. (2008, Science)
Oxford’s planetary data analysis group has developed a suite of sophisticated software tools to interpret the CIRS observations, allowing a reconstruction of the three-dimensional atmospheric temperature and composition of Saturn and Titan.  The data interpretation relies on precise laboratory measurements of gaseous spectra from Oxford’s planetary spectroscopy facility, allowing us to identify individual gases by their unique fingerprints.  By combining these tools, Oxford scientists have revealed Saturn’s seasonally evolving temperatures, including the discovery of hot polar cyclones churning at both poles of Saturn; a bizarre hexagonal wave encircling Saturn’s north pole; and tracked the eruption of an enormous storm system in 2010-11 that spawned a gigantic (but short-lived) vortex in Saturn’s stratosphere (nicknamed the ‘beacon’).  On Titan, Oxford researchers have studied the dynamics and meteorology of the intense north polar winter vortex, and the forming south polar vortex as the southern hemisphere descends into winter darkness.  The atmospheric dynamics of these alien worlds have been simulated by Oxford’s Geophysical Fluid Dynamics group, both numerically using sophisticated general circulation models (GCMs) and in the laboratory using rotating fluid experiments.  One such laboratory experiment was able to reproduce the six-sided hexagonal wave present at Saturn’s north pole.  

Titan's evolving seasons monitored by
Cassini/CIRS (Teanby et al., 2012)
Oxford’s involvement in Cassini and the CIRS experiment has provided doctoral training to many students who have earned their PhDs as part of this project (including me!), and employed several postdocs that have gone on to become experts in their fields.  Today, Oxford’s planetary science group continues to look ahead to future missions exploring our Solar System and studying the extreme climates of planets around other stars, but Cassini has proven the most successful and long-lived of these endeavours.  When the mission finally ends in 2017, burning up in the atmosphere of Saturn, it will rightly be remembered as the most successful outer solar system mission in our history, and as Oxford’s most distant planetary hardware to date.

Monday, 19 May 2014

Fermor Meeting 2014: Jets, Waves and Vortices

In May 2014 I was invited to give a talk at the Fermor Comparative Planetology meeting at the Royal Geological Society, a two-day event in London with a primary focus on terrestrial worlds but with some small component of atmospheric science.  This blog post is a summary of that presentation, helping me to organise my thoughts and ideas before standing up in front of that audience!

The four giant planets of our Solar System are our closest examples of a class of astrophysical object that now appears commonplace in our galaxy.  Their formation and orbital evolution shaped the planetary system we see around us today; each world is accompanied by a diverse collection of rings and satellites that may host habitable conditions; and their enormous atmospheres serve as planetary-scale laboratories for the physical and chemical phenomena governing the general properties of atmospheres and oceans.  Comparative planetology of the four giants therefore provides an extreme test of our understanding of atmospheric processes under a range of different climatological and environmental conditions.

How to Build a Giant Planet?
Processes influencing the spectrum of a
 giant planet, from the cool jovians to the hottest
exo-Jupiters (Fletcher et al., 2014)


So what shapes the climate of a giant planet, and how do these environmental conditions relate to their visible properties?  Despite the visible differences in zonal banding, weather activity, cloud colours and chemistry, the four giants exist on a continuum that ranges from the hydrogen-rich, highly irradiated hot Jupiters (2500 K) to the cool jovians of our own solar system (100 K).  The emerging spectrum that we measure from a giant planet is approximately shaped by five inter-related factors:  (i) the  balance of elements and isotopes in the source reservoirs from which the planets formed; (ii) the atmospheric temperature structure that governs the thermochemical stability of these materials (e.g., methane or CO, ammonia or N2, etc.); (iii) the influence of the parent star providing the energy for meteorology and atmospheric photochemistry; (iv) atmospheric mixing of materials from the deepest to the highest layers; and (v) the condensation of volatiles into discrete cloud decks.  The latter process is highly temperature dependent - as we warm the atmosphere from the coldest Neptune to the hottest Jupiter, we evaporate clouds to release the gases back into the vapour phase.  So on the hottest Jupiters, clouds of ceramics, irons and silicates will exist, intermediate Jupiters might have clouds of water vapour at the top of the atmosphere (this might have been what Jupiter was like in the early days after its formation), and our present-day gas giants have clouds of ammonia ice.  For our solar system, this condensate sequence, although simplified, explains why key volatiles like ammonia and water are locked away beneath condensation clouds in the deeper troposphere.  On the cold ice giants, even methane can condense to form the topmost clouds.

The details of the chemistry depend on the balance of elements imprinted at the time of planet accretion, which provides the source materials for the reducing atmosphere.  Observations have shown that all the giant planets are enriched in composition over protosolar abundances, suggesting accretion of rock-ice material along with the collapsing hydrogen-helium envelope as the giant planets formed.  By measuring the abundances of several key species (hydrogen, carbon, oxygen, nitrogen, sulphur, etc.), we gain a window onto the processes at work during this planetary accretion.  Deuterium and carbon enrichments suggest that the planets fall into two categories - the gas giants having 0.2-0.5% carbon and a D/H of 2e-5; the ice giants having 3-4% carbon and D/H of 4e-5.  Note that there is no way to discriminate between Uranus and Neptune on compositional grounds, as was previously thought.  Constraints from other species (e.g., the volatiles NH3, H2S and H2O) are much harder to measure because they are locked away beneath the deep condensation clouds.  In a recent paper, we used ground-based infrared observations to show that the 15N/14N ratio on Jupiter and Saturn were indistinguishable, suggesting that 15N-enriched ammonia ices could not have been a major contributor to either planet, and they instead acquired their nitrogen by accretion of N2, potentially from the gas phase rather than accretion of solids.  H2S and H2O are even harder, and we hope that NASA’s Juno mission might help constrain Jupiter’s bulk oxygen enrichment.  Failing that, we need comparative in situ probing of each of these worlds to make further progress.

The Anatomy of a Giant

Each of the giant planets features a banded structure, with powerful eastward and westward jets separating belts and zones of differing thermal and chemical properties.  Those jets are subject to spontaneous instabilities and can meander (such as Saturn’s hexagonal polar jet), exhibit wave activity (e.g., Jupiter’s northern equatorial hotspots) and spawn eddies and vortices.  This horizontal organisation varies from planet to planet – the ice giants feature broad, retrograde equatorial jets; whereas the gas giants feature strong prograde jets with multiple extra-tropical jets.  The circulation regimes appear to vary dramatically as we move from the stratosphere (wave-dominated and radiatively-cooled) to the deeper troposphere (convective overturning, lightning and eddy-driven winds and storms).  The banded structures themselves are subject to global-scale variability (such as the recent fade and revival of Jupiter's South Equatorial Belt and storm eruptions on Saturn) that reveals insights into the deep processes powering and maintaining the planet’s appearance.  Vortices vary in size and longevity, from Jupiter’s long-lived Great Red Spot to the sporadic dark ovals (and associated white orographic clouds) of the ice giants.   Superimposed on these regional features are seasonal asymmetries of temperature, clouds and composition driven by insolation changes, varying from the negligible seasonal influence of Jupiter, to the Earth-like axial tilts of Saturn and Neptune (and associated polar vortices) and the extreme obliquity of Uranus (98o).  
The anatomy of a giant planet from the equator to the poles.

As we move from the equator to the extratropical bands and towards the poles, we transition from a horizontally-organised atmosphere to small-scale turbulence at the highest latitudes.  The poles of the giants have a more mottled appearance, and are the apex of a planet-wide circulation system and the site of a unique connection between the neutral atmosphere and the charged magnetospheric environment.  Jupiter’s poles have never been directly imaged as the majority of previous missions flew past or orbited in the equatorial plane, so we await Juno’s exploration to provide our first glimpses of the highest latitudes.  Conversely, Saturn’s seasonal poles have been scrutinised for a decade by Cassini, revealing season stratospheric vortices, long-lived polar cyclones at both poles (hot cyclones related to hurricane-like eyewalls), and a strange hexagonal wave.  Uranus’ poles feature seasonally-variable aerosol ‘hoods’ and have been revealed in depth by recent high-contrast ground-based imaging from Keck.  Neptune’s warm polar vortex was recently shown to have developed since the Voyager encounter in 1989, but also features small-scale clouds right at the pole.  A recently processed Voyager observation by Rolf Olsen has suggested the existence of a hexagonal wave at Neptune’s south pole, but this needs detailed scrutiny as it appears transient, differing from image to image.  Nevertheless, it shows that the solar system still holds many surprises!

Possible evidence of a hexagonal wave on
Neptune (Rolf Olsen)

Explaining those Stripes

The primary effect of an atmosphere is to redistribute energy, generally from the equator to the pole.  Horizontal banding is the key, distinguishing feature of our giant planets, with the Coriolis effect due to their rapid rotation splitting the equator-to-pole circulation into a series of zones and belts.  Earth has three such circulation cells (Hadley Cell, Ferrell Cell and Polar Cell, with associated zonal winds like the trade wind easterlies and the mid-latitude westerlies), whereas the gas giants have many more and the picture on the ice giants is still unclear.  On Jupiter and Saturn, the old paradigm was to have air rising in anticyclonic, cool and cloudy zones, and falling in cyclonic, warm and cloud-free belts.  This pattern of rising and falling air is consistent with the observed temperature and cloud patterns.  But today we know the picture to be more complex than this.  Indeed, the cold and cloudy upper troposphere of anticyclonic regions may be a natural consequence of the vertical stratification of the atmosphere - the air must cool and expand above a high pressure region in order that it can fit beneath the rigid and stabilised tropopause, which resists bulging upwards over a high pressure anticyclone and resists bulging downwards over a low pressure cyclone.  In this sense, the cloudiness and cold temperatures are natural features of the primary circulation (i.e., that related to the horizontal winds alone and the vertical shear related to stratification), without requiring the vertical motions.  Of course, vertical motions may be later induced by these temperature anomalies as part of a secondary circulation, but they are not the driving force behind the cloudiness (Palotai, Dowling and Fletcher, 2014).

Coupled with this are recent observations by Galileo and Cassini:  lightning strikes appear to occur primarily in the cyclonic belts (where we’d previously assumed downwelling), and eddy momentum flux convergence tends to pump the zonal jets, consistent with an overturning circulation precisely opposite to our canonical view.  This opens the prospect of multiple stacked circulation cells, such that air actually rises in the lower part of a belt, but sinks in the upper part.  The necessity for two cells on top of one another might be a consequence of the transition from a regime where small eddies pump the jets to a regime where the jets are being damped and the zonal winds decay with altitude.  All this is tied to the condensation of clouds and the release of latent heat, but there is currently no convincing tropospheric meteorological model to explain all the observations.  Furthermore, the vertical structure of the winds (i.e., how far they penetrate into the deeper troposphere or the stratosphere) is far from certain.

On a small scale, the same atmospheric circulation can be applied to our understanding of vortices.  These rotating storms are common place, such as the cloudy and cold anticyclones of the giant planets (the Great Red Spot, Oval BA and Saturn’s storm-created vortices) and the dark ovals of the ice giants (like Neptune’s Great Dark Spot) and their associated bright orographic clouds (i.e., clouds forming over the regions of strong pressure gradients). Once again, the cold top halves of the vortices are explained as a natural consequence of having a high-pressure core beneath a rigid tropopause, and this thermal anomaly induces secondary circulation (central upwelling and peripheral downwelling).  The different appearances of the vortices depend on their size and where the downwelling can occur - sometimes it can create a red ring within the anticyclone, sometimes a bright periphery, and in the case of the Great Red Spot it can also cause a warm sub-vortex (Fletcher et al., 2010).  But this all suggests a warm core to the anticyclones at depth (maybe below the clouds) associated with the latent heat release of water condensation, which to date has never been observed.  Our next steps must be to probe the thermal conditions below the clouds to understand the circulation of these vortices.

As an aside, the largest anticyclones are known to vary and change by subsuming smaller vortices and eddies.  The Great Red Spot has been shrinking steadily in the east-west direction ever since records began, and recent observations by the Hubble Space Telescope (April 2014) have indicated that the spot is smaller, and more circular, than ever before.  No one knows what the fate of the Great Red Spot may be, but it is certain that this shrinkage is currently accelerating.
Hubble observations of the shrinking Great
Red Spot since 1995.

Constantly Evolving Atmospheres

Despite the constant banded structure and the slow seasonal evolution, the atmospheres of the giants are continuously shifting and changing.  The visibility of the churning troposphere varies from planet to planet due to obscuring hazes overlying the main cloud decks, but every so often a plume driven by the condensation of water will erupt through these cloud decks.  These spectacular plumes dredge material from the deeper atmosphere which is then redistributed by the powerful zonal winds.  Examples include the plumes that revived the faded South Equatorial Belt on Jupiter (punching through the haze that had formed to hide the typically brown belt beneath a white veil) and the storm plumes on Saturn in 2010-11 that produced dramatic effects on Saturn’s springtime hemisphere.  Discrete convective events are also visible on the ice giants, although their nature and composition are unclear.

These strong tropospheric events can excite waves (gravity waves, Rossby waves, etc.) that propagate upwards into the more stable middle atmosphere.  Indeed, maps of stratospheric temperature obtained from ground-based observatories show that Jupiter’s stratospheric appearance is dominated by these slowly-moving wave trains that shift from night to night and vary in amplitude.  In the most extreme case, the transport of energy by these waves led to the emergence of an enormous anticyclone in Saturn’s stratosphere (nicknamed the ‘beacon’).  This vortex, invisible in reflected sunlight due to its altitude hundreds of kilometres above the clouds, was short lived but larger, at its peak, than Jupiter’s famous Great Red Spot.  We’re starting to appreciate just how important wave activity is to the middle atmospheric structure of the giant planets.  Even in the troposphere, wave activity is commonplace - from the chevrons and hotspots seen in Jupiter’s equatorial region that may be manifestations of Rossby wave activity; meandering jet streams forming ribbon waves and hexagons on Saturn; and the equatorial scalloped wave recently revealed by Keck imaging of Uranus.  The atmospheres of Jupiter and Saturn appear to be ‘marginally’ or ‘neutrally’ stable, which means that it doesn’t take much to excite instabilities, form eddies and wave phenomena.  

Summary

It is perhaps unsurprising that the four giant planets of our solar system share such commonalities - banded atmospheric structures, convectively-active tropospheres spawning eddies, waves and large-scale vortices; stable middle atmospheres perturbed by wave activity; polar regions that are unique compared to the horizontal organisation of the tropical latitudes.  But the small differences in how these processes differ from planet to planet reveal much about the background state of each atmosphere.  This presentation has shown how cloud condensation, chemistry, zonal jet pumping, tropospheric overturning, vortices and waves can shape the climates of the four giant planets.  We showed how the general properties of these worlds can be explained by the source materials imprinted by their formation and the vertical thermal structures.  We also saw that exploration still reveals surprises, from the shrinking Great Red Spot, the possibility of a hexagonal wave on Neptune, and gigantic invisible stratospheric vortices on Saturn.  

The next evolution of our understanding of the giant planets requires long-term, self consistent datasets over multiple years to track the atmospheric evolution.  A broad wavelength range is required to connect the visible appearance at the cloud tops to the environmental conditions (temperatures, humidity, chemistry, winds) measured at longer wavelengths.  Furthermore, in situ exploration of these worlds by entry probes (or buoyant weather stations - we can hope!) is needed to provide ground-truth for the remote sensing, and penetrate below the cloud tops.  

Friday, 16 May 2014

Ammonia Snow and Circulation of the Great Red Spot

Back in 2009, while I was still a postdoc at JPL, I worked with Glenn Orton on a paper combining thermal imaging from Cassini and large ground-based observatories to study the structure and composition of Jupiter's Great Red Spot.  We presented the highest resolution infrared images of the GRS ever obtained (from the VISIR instrument on the ESO Very Large Telescope), comparing the temperature contrasts to visible-light imaging from Hubble to understand the 3D properties of the solar system's best-known storm system.  We confirmed the cold core of the anticyclone (first suggested in Voyager thermal imaging by Hanel, Flasar et al.), but discovered a warm heart to the GRS - a central core that was warmer than the surroundings and coincident with a possible reversal of the typically anti-clockwise winds.  This subvortex was considered to be a region of subsidence in an otherwise upwelling anticyclone.  The GRS was surrounded by a peripheral lane of decreased aerosol opacity, suggesting a cloud-free ring of atmospheric subsidence and a barrier, keeping the red GRS aerosols separated from the white aerosols surrounding it.  Everything within the centre of the GRS is trapped by strong gradients of potential vorticity (like a polar vortex), and so it's old and continually zapped by UV rays, which might contribute to the deep red-orange colours.
Thermal imaging of the Great Red Spot and Oval BA
compared to Hubble imaging in 2006 (Fletcher et al., 2010)

Motivated by this, and other studies of the structure of the GRS, Csaba Palotai and Tim Dowling worked to create a model of the vortex using a realistic system of ammonia clouds (leaving the deeper water clouds aside for the time being) and the highest vertical resolution used to date.  They used the EPIC atmospheric model (Dowling et al., 2006) with an active hydrological cycle for ammonia, including the production of ammonia snow.  Their model cloud distributions resemble the images we regularly see from spacecraft and ground-based telescopes, and reproduced a warm core feature at some altitudes, but revealed a good deal more about what's actually going on.  Instead of the clouds being moved into place by upwelling within the core of the vortex, they found that the ammonia clouds condensed as soon as the cloud microphysics packages were switched on.  That means that the clouds form over the GRS as a natural consequence of the cold temperatures in the top half of the vortex.  And the vortex is cold so that it can fit underneath the rigid tropopause, which resists bulging upwards over the high pressure anticyclone.  So although some secondary vertical motions will no doubt exist because of the thermal anomalies, they are not required to explain the cold temperatures and cloudy conditions prevailing at the top of the Great Red Spot.

It's worth considering this in detail, because my own naive impression had always been that the anticyclones were cold because of upwelling and adiabatic expansion.  What we're saying now is that the cold temperatures are a natural consequence of the stratification of the atmosphere above the vortex, and the resulting thermal wind shears that serve to damp the circulating vortex to slower and slower speeds as we move towards the tropopause.  These wind-related features are primary circulation features.  We're not saying that secondary circulations like upwelling and downwelling don't exist (indeed they must to explain some of the properties of the GRS in our 2010 observational paper), but that the cold core and cloudiness don't need vertical motions to explain them.

The vortex is introduced in the model as a high pressure core, which is the vertical centre of the vortex.  Interestingly, whereever this centre was introduced, it seemed to move to around the 500 mbar level.  At higher altitudes, the model vortex was a cold core, as we see in our data.  But deeper down, the simulations suggest the GRS should be warmer than the surroundings, which is incompatable with the observations.  Now, thermal remote sensing only sounds down to around the cloud-tops at 700-800 mbar, but nevertheless, there's never been any hints that the GRS should be warmer at those depths.  Something doesn't add up.  Maybe the vortex centre in the model should be deeper, or maybe turning on the water to an active hydrological cycle would also help improve things.
A possible schematic of secondary circulation pattern within
a jovian anticyclone by Marcus et al., (2013)

In any case, I learned a lot from collaborating with Palotai and Dowling on their recent paper, including their warning not to mix up the primary circulation features (related to winds, high pressure cores, wind shears and stratification) and secondary circulation features (those caused by upwelling and downwelling):  "...unfortunately, this fallacy that clouds and cold cores require upwelling is very deeply ingrained in the planetary-science community... Gill (1982) shows that thermal windshear temperature anomalies are primary circulation features, not secondary ones...."

They propose that the primary circulation creates anomalies that certainly contribute to the existence of the secondary circulation, but they should not be significantly affected by it if the secondary circulation is weak.  Dowling used the example of the anvil head of a thunderstorm cloud, which is not caused by upwelling and sidewelling, but rather by the jump in stratification at the tropopause.  "Put simply, a tropospheric anticyclone’s top centre is cool so that it can fit under the tropopause, which resists bulging up to make room. Likewise, a tropospheric cyclone’s top centre is warm because the tropopause resists being pulled down."  The secondary circulation is certainly important, driving contrasts in passive tracers like phosphine and para-hydrogen, and the peripheral ring of cloud-free conditions (see de Pater et al., 2010 and Marcus 2013, for example).  The eyewalls of the polar cyclones on Saturn may be examples of strong secondary circulations.  In any case, the combination of models with active clouds, condensation and snow, with the high-resolution multi-wavelength imaging available from observers, will hopefully provide new insights into the vertical structures of these enormous anticyclones.

Further Reading:

  • L. N. Fletcher, Orton, G. S. Yanamandra-Fisher, P., Irwin, P. G. J. Baines, K. H. Edkins, E., Line, M. R., Mousis, O., Parrish, P. D., Vanzi, L., Fuse, T., Fujoyoshi, T., 2010, Thermal Structure and Composition of Jupiter’s Great Red Spot from High-Resolution Thermal Imaging, Icarus 208, p 306-328 (http://dx.doi.org/10.1016/j.icarus.2010.01.005)
  • Palotai, C., Dowling, T.E., Fletcher, L.N., (2014), 3D Modelling of Interactions Between Jupiter's Ammonia Clouds and Large Anticyclones, Icarus, Volume 232, April 2014, Pages 141–156 (http://dx.doi.org/10.1016/j.icarus.2014.01.005)
  • de Pater, I., Wong, M.H., Marcus, P., Luszcz-Cook, S., Ádámkovics, M., Conrad, A., Asay-Davis, X., Go, C., 2010. Persistent rings in and around Jupiter’s anticyclones – Observations and theory. Icarus 210, 742–762.
  • Marcus, P.S., Asay-Davis, X., Wong, M.H., de Pater, I., 2013. Jupiters Red Oval BA: Dynamics, color, and relationship to jovian climate change. J. Heat Trans. 135,1–9.


Tuesday, 8 April 2014

Carbon on the Ice Giants

The bulk composition of a giant planet provides insights into the source reservoirs from which it formed, and a window onto the epoch of planetary formation.  For the gas giants Jupiter and Saturn, Galileo and Cassini observations are starting to pin down the abundances of key elements and isotopes (with lots of caveats, especially regarding oxygen).  But for the ice giants Uranus and Neptune, the story is murkier and incomplete.  Until recently, the data seemed to suggest that both the bulk abundances of deuterium and carbon were increasing with distance from the Sun, such that Uranus and Neptune were distinct in terms of their compositional make up.  But more recent observations, from sources like Hubble and Herschel, have shown that this is untrue, and that distinguishing between Uranus and Neptune on the basis of composition is rather more challenging!

On Uranus, the best estimate of the methane mole fraction has been bouncing around a lot over the past few years.  Lindal et al. (1987) measured a 2.3% mole fraction from Voyager radio occultations.  But this was just one of a suite of possible solutions, up to a maximum of 4%.  Baines et al. (1995) inferred a much smaller deep value of 1.6{-0.5,+0.7}% using ground-based spectroscopic observations in the near infrared.  In 2011, Larry Sromovsky combined the Lindal radio refractivity profiles with cloud fitting to HST/STIS data, and found good matches to the data with 3.2-4.5%. Their ‘best compromise’ was 4.0±0.5% at low latitudes on Uranus.

But the problem is that methane appears to be depleted at high latitudes (Karkoschka and Tomasko, 2009; Sromovsky et al., 2011) due to atmospheric subsidence, so the equatorial values have to be taken as indicative of the bulk abundance but could be being redistrubuted by the circulation of Uranus' troposphere.  So there’s a lot of uncertainty out there.  The Baines et al. (1995) value of 1.6% is on the low side, whereas Sromovsky and colleagues seem to favour higher values of around 4% tropospheric methane.

And what about Neptune?  If we look at the study by Karkoschka and Tomasko (2011, Icarus 211 p780-797) using Hubble STIS data, they suggest 4±1% for methane mixing ratio for depths below 3.3 bar, with meridional variations by a factor of three at shallower depths.    So it seems hard to distinguish between Uranus and Neptune in terms of their bulk composition, specifically the abundance of carbon.  Although the values are highly uncertain, both worlds appear to be enriched over protosolar values by a factor of around 90 (Guillot and Gautier, 2014, Treatise on Geophysics).   The same is also true for HD/H2, which has been shown by Herschel (and others) to be the same on both ice giants, indicating that they both formed from similar icy source reservoirs in the distant past.


Tuesday, 11 February 2014

Oxford Researchers on BBC Sky at Night

From an Oxford new release:  AOPP researchers feature strongly as contributors to the first edition of the new series (season two!) of the BBC's Sky at Night programme on BBC4 presented by Dr. Maggie Aderin-Pocock and Oxford Astrophysics's Chris Lintott.


Prof. Peter Read demonstrated a laboratory experiment with guest presenter Helen Czerski that may help to explain the origin of Jupiter's Great Red Spot and other giant, long-lived storms that dominate the weather on Jupiter. In contrast to the Earth, where large-scale temperature contrasts are primarily between the equator and poles, on Jupiter the contrasts are strongest between the bright and dark bands.  The temperature changes considerably from the warm dark belts to the colder, brighter zones.  Peter's experiments show that the main instability of such a flow leads to the formation of compact, recirculating vortices - which look very similar to those seen on Jupiter.

The formation of Jupiter's zonal bands may also result from the effects of its very rapid rotation (once every ten hours) and the curvature of the planet. This was graphically illustrated in Helen Czerski's presentation of some numerical model simulations by AOPP graduate student Yixiong Wang, which show that an Earth-like planetary atmosphere would spontaneously break up into multiple zonal bands if, like Jupiter, the planet were much bigger than Earth and/or it rotated much more rapidly.

The show also ventured out into the Jupiter system to explore some of the processes at work on its diverse collection of moons.  Dr. Leigh Fletcher explained the significance of recent discoveries about the moon Europa, in conversation with Chris Lintott.  Europa has long been regarded as a potentially-habitable environment (i.e., it may have all the ingredients necessary to support life), and as a tantalising destination for future exploration.  Chaotic terrain at Europa's low latitudes has the appearance of ice bergs locked into a frozen sea, allowing us to understand the properties of the global, sub-surface ocean by reading the geology and chemistry on Europa's icy surface.
Artist impression of ultraviolet emission from plumes of
water emanating from Europa's south polar region.
Credit:  NASA, ESA, and M. Kornmesser.

However, new findings from the Hubble Space Telescope suggest another way of probing this deep, hidden ocean - geysers of water appear to be venting 200 km high over Europa's south pole, similar to those found previously on Saturn's icy moon Enceladus.  Leigh described the implications of this discovery for the exploration of the jovian system by ESA's Jupiter Icy Moons Explorer (JUICE), expected to launch in the 2020s.  In particular, Oxford is a co-investigator on the US-led ultraviolet spectrograph (UVS) which will be conducting sensitive searches for this type of spectacular geologic  activity on Jupiter's moons.

The programme is available for another week on BBC i-Player (see http://www.bbc.co.uk/programmes/b03vg99x)

Further details of the Europa plume discovery and JUICE mission can be found here:
http://planetaryweather.blogspot.co.uk/2013/12/the-plumes-of-europa.html

…and a discussion of what gives Jupiter its colourful stripes:
http://planetaryweather.blogspot.co.uk/2014/01/what-gives-jupiter-its-colourful-stripes.html

Monday, 27 January 2014

Jupiter's Realm: An Introduction to the Galilean Satellites

A comparison of the surface features on the Galilean satellites 

from the NASA photojournal (Credit: NASA/JPL/DLR)
The Jupiter system consists of four large satellites (Io, Europa, Ganymede and Callisto, all over 3000 km in diameter); a ring system; four small satellites (Metis, Adrastea, Amalthea and Thebe, 10-100 km diameters) interior to Io's orbit; and a group of at least 55 irregular satellites out beyond Callisto.  Europa is the smallest of the four moons at 3120 km across (just slightly smaller than our own Moon's 3774 km diameter); Ganymede is the largest at 5258 km across, making it the largest moon in the solar system.  We sometimes refer to these worlds as those of "fire and ice", due to the combination of volcanism and icy oceans that shapes their appearance.  The amount of ice in the moons increases with distance from Jupiter - Io is primarily silicate rock with a molten iron or iron sulphide core, whereas Ganymede and Callisto are composed or roughly equal amounts of ice and rock.

Tides and Geology
The internal structure, surface properties and geologic activity of these moons are shaped by their distance from Jupiter - from the materials available where they formed, to the strength of tidal forces warming their interiors and the strength of the radiation field sterilising their surfaces (a handicap for potential surface habitability).  Tidal interactions due to Io, Europa and Ganymede being trapped in the Laplace resonance are responsible for Io's spectacular volcanism and the presence of subsurface oceans on the other moons.  For example, Io's and Europa's orbits are not perfect circles, and the gravitational forces are stronger when the moon is at its closest to Jupiter.  That means that the degree of tidal flexing changes during the orbit, kneading the interior and providing a source of energy.  Geological activity appears to decrease as we move outward, arriving at the 'dead world' of Callisto that appears the least differentiated of all the satellites.  Callisto has the least severe radiation environment as it orbits further outside of Jupiter's radiation belts, and does not participate in the resonance of the other three Galilean satellites.

Hidden Oceans
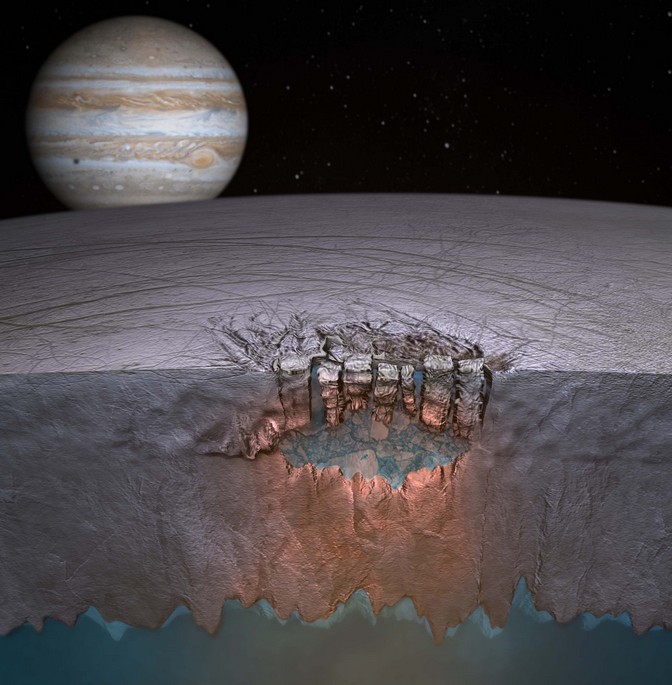
Artist impression of a lake beneath Europan 

chaos terrain, above a global subsurface ocean.  

Credit:  University of Texas at Austin
The Galileo spacecraft discovered evidence for subsurface oceans hidden beneath the icy crusts of Europa, Ganymede and Callisto.  Estimates of the ice thickness range up to 100 km for Europa and thicker for the other satellites, depending on the degree of convective activity.   The salty oceans are electrically conducting, so Jupiter's magnetic field is able to induce secondary magnetic fields into these oceans that were then detectable by Galileo which, in addition to ocean-related surface characteristics and models of the thermal evolution of these moons, advocate for the presence of liquid water oceans.   These oceans are kept liquid by a combination of tidal energy dissipation (most important for Io and Europa) and radiogenic heating (most important for Ganymede).  Of the three, Europa is unique in that the ocean may be in direct contact with the rocky silicates of the interior, possibly providing salts and other essential elements to the ocean.  This 'sea floor' may be geologically active like the biologically-rich environment on Earth (e.g., the black smokers).   Conversely, the oceans of Ganymede and Callisto may be sandwiched between layers of thick ice, making it harder to exchange energy and chemicals between the rock and the ocean.  These moons are larger than Europa, and internal pressures may be sufficient to form high-pressure ice phases in the deep interior.

Materials from these internal oceans may be able to rise to the surfaces of Europa and Ganymede, where they are then altered by interaction with Jupiter's radiation and plasma environment, which is stronger at Europa than at Ganymede.  Ice fractures and cryo-magmatic processes (e.g., volcanism, only with ice as the magma) could transport volatiles, organics and minerals upwards to be detected on the satellite surfaces. There are substantial amounts of non-water ice material on the surfaces of all of these satellites, but their origin and relation to subsurface oceans is unclear.

Magnetic Fields
Ganymede is one of only three solid state bodies in the solar system to generate a magnetic field of their own, next to Earth and Mercury, within their liquid iron-rich cores.  This internal magnetic field creates a miniature Ganymede magnetosphere embedded in, and interacting with, the much larger magnetosphere of Jupiter.

Locked Orbits and Asymmetry
The Galilean moons are locked in a stable 1:1 spin orbit resonance, which means that one face is always pointed directly at Jupiter (i.e., it would always be directly overhead if one stood at the sub-jovian point). That also means that the length of the day is the same as the orbital period:  Io takes 1.8 days to orbit Jupiter, Europa takes 3.6 days, Ganymede takes 7.2 days and Callisto takes 16.7 days. On most of the satellites it is possible to distinguish differences in brightness between the leading (forward-facing) and trailing (back-facing) hemispheres, as magnetospheric plasma are continually blasting the trailing hemisphere due to the rapid rotation of the magnetosphere.

Tenuous Atmospheres
All of the moons possess exospheres (a thin atmosphere) and ionospheres, and Ganymede is known to exhibit auroral emissions due to the interaction of its magnetic field with the jovian magnetosphere.  Io has an aurora-like glow that is brightest near the equator (because Io lacks an intrinsic magnetic field).  The exospheres are the result of materials either sublimating or being sputtered (i.e., knocked off by particle bombardment) from the surface.  Europa's atmosphere is extremely thin and composed mostly of O2 released from the surface due to magnetospheric particle bombardment.  Some of the escapes hydrogen and oxygen forms a neutral cloud (a torus) around Jupiter, adding plasma into the magnetosphere just like Io.  Ganymede also possesses a thin oxygen exosphere, whereas Callisto's thin atmosphere may be made up of CO2.

The surface geology of the satellites is shaped by a variety of competing internal and external processes, including marine, convective, cryovolcanic, tectonic, surface degradation and impact phenomena.  We'll now look at each of the satellites in turn, giving an overview of some of the key features on these worlds.

Surface of Io
Map of Io assembled by the British Astronomical Society based on a basemap by the USGS.

  • Io has over 400 active volcanoes, driven from frictional heating as Io is tidally stressed by Jupiter and the other Galilean satellites.  Up to 20% of Io's mantle may be molten, with higher melt fractions near regions of high temperature volcanism.
  • Sulphurous umbrella-shaped plumes can reach hundreds of kilometres above the surface, coating the surrounding planes with colourful sulphur and SO2 frost, contributing to the thin SO2 atmosphere, and suppling material to the Io plasma torus surrounding Jupiter.  
  • Lava flows up to 500 km long cover the surface, between mountains, plateaus, layered terrains and shield volcanoes.  
  • Pele is one of Io's active volcanoes, associated with a lava lake and encircled by a large red sulphurous ring.  It has a patera 30km by 20km in size, and has produced plumes 300 km tall associated with peak temperatures of 1250 degrees celsius or more.
  • Categories of geological features include paterae (volcanic depressions resembling calderas), fluctus (lava flows), vallis (lava channels) and eruption centres.  The largest patera is Loki, with a diameter of 202 km.
  • Io has up to 150 mountains, some larger than Mount Everest.  The largest is South Boosaule Montes at 17.5 km tall.  These mountains are tectonic structures, due to compression at the base of the lithosphere, rather than being due to volcanism.  Some mountains show signs of large landslides on their flanks. Mountains dominate the areas with fewer volcanoes, and vice versa.
  • The first Io plume was spotted after the Voyager 1 encounter in 1979, one of nine plumes spotted in that flyby.  Four months later, when Voyager 2 flew past, 7 of the 9 plumes were still active and the morphology of the surface terrain had been altered, with the volcano Pele shutting down in between the two encounters.  Galileo measured more plumes and the thermal emission from the cooling surface magma.
  • Cassini spotted a plume at Tvashtar Paterae during the December 2000 flyby en route to the Saturn system.  New Horizons monitored further eruptions in 2007, including Girru Patera in the early stages of an eruption.
  • The young and active surface is almost completely lacking in impact craters.  


Surface of Europa


Annotated map of Europa, using the combination of Bjorn Jonsson's basemap, the projection available from the British Astronomical Association, and details from the USGS.

  • Europa's surface is one of the smoothest in the solar system, and is divided into bright plains with numerous dark parallel linear ridges (lineae), and a darker more mottled terrain known as regio.  
  • The most common types of ridges appear in pairs with a trough in between possibly originating from tectonism, cryovolcanism or other processes requiring liquid water in the subsurface or mobile ice.  
  • The bright planes are separated by these dark lineae, possibly related to crustal spreading as plates move on top of the more mobile sub-surface, rather like the crustal movement seen in Earth's ocean ridges.  
  • Chaos terrains (such as Conamara Chaos, just south of the 'X' made by two crossing Lineae, Asterius Linea and Agave Linea) are regions where the pre-existing planes are broken up, rotated and tilted, resulting in a 'hummocky' terrain akin to ice rafts floating on a frozen sea.  Research in 2011 suggested that these chaos terrains could be sat on lakes of liquid water embedded in the ice shell, and distinct from the deeper liquid ocean.   
  • Craters are rare on Europa, indicating a young surface age, but one of the most distinct is the young and bright Pwyll crater, 26 km in diameter with a 600 metre high central peak, surrounding by bright rays of debris.  
  • Europa's equatorial region may feature 10-m tall icy spikes (penitentes) resulting from melting.  
  • Numerous circular or elliptical domes, pits and spots can be found, known as lenticulae and potentially caused by warm ice moving upwards through the colder icy crust.  
  • Most recently, it appears that Europa has periodic plume eruptions from somewhere near its south pole (see my post on "The Plumes of Europa").  
  • Dark regions or spots (maculae), such as Thera and Thrace, could be relatively young enriched regions of non-water ices, possibly due to liquid emplacement.  
  • The dark regiones are named after locations in Celtic mythology, dark spots (maculae) from Greek mythology, and crater names come from Celtic myths and folklore.


Surface of Ganymede
Map of Ganymede assembled by the British Astronomical Society based on a basemap by Bjorn Jonsson.

  • Ganymede's surface is divided into dark and densely-cratered ancient terrain covering about a third of the surface, and bright, younger and grooved terrain showing evidence of tectonic disruption.  
  • Furrows seen in the ancient terrain (a hemisphere-scale set of concentric troughs) may be remnants of vast multi-ring impact basins.  
  • Galileo Regio is a significant dark plane containing a series of concentric furrows on the anti-jovian hemisphere.  It is separated from the dark Marius Regio by the bright young band of Uruk sulcus.
  • Although the surface is largely made of ice, the darker ice is due to non-water contaminants concentrated on the surface.  The darker terrain is divided by brighter regions called sulci.  The brighter, fresher terrain is likely to be the product of tectonic resurfacing over the ancient terrain.  
  • There are indications of caldera-like depressions (called paterae) that could be old volcanic vents, and suggestions of ridged deposits nearby that could have resulted from cryovolcanic flows.  
  • Ganymede's impact features are more diverse than on any other planetary surface, from vast multi-ring structures, to low relief ancient scars, craters with pits and domes, bright ray craters and dark floor craters.  Craters are seen on both the light and dark terrain, and some overlap the grooved systems indicating the extreme age of the grooves.
  • Osiris crater is a bright ray crater with fresh ice ejection to the south of Galileo Regio.
  • Palimpsests are ancient craters whose relief has largely disappeared.
  • Grooved terrain is brighter and more ice-rich than the darker terrain.  Salts, CO2, SO2 and other compounds have been inferred on the surface.  
  • Ganymede's surface is brighter on the leading hemisphere.
  • Ganymede features polar caps of water frost extending to 40 degree latitude, possibly related to plasma bombardment from the magnetic field (the polar regions are unprotected from such bombardment, enhancing sputtering there).


Surface of Callisto
Map of Callisto assembled by the British Astronomical Society based on a basemap by Bjorn Jonsson.

  • Callisto's surface is the most ancient of all, a heavily cratered world bearing witness to the full bombardment history of our solar system.  There are no large mountains, volcanoes, or tectonic structures.  Tectonism is less wide spread than on the other satellites, although some furrows and lineaments are seen.  
  • The surface is dominated by multi-ring structures, crater chains (catenae, named after rivers in Norse mythology) and associated scarps, ridges and deposits.
  • Small craters have bowl shapes, moderate craters have central peaks, some larger ones have central puts, whereas the largest (over 60 km diameter) have central domes due to tectonic uplift following an impact (e.g., Doh and Har craters).
  • Bright frost deposits are seen in elevated regions (crater rims, scarps and ridges), surrounding by a blanket of darker materials in the lowlands.  The surface is predominantly water ice, contaminated by various non-ice materials like silicates, CO2, SO2 and possibly ammonia.  The trailing hemisphere is darker and enriched in CO2 ice, whereas the leading hemisphere is brighter and has more SO2.  
  • Burr and Lofn are bright and relatively  fresh impact craters that shows an enhancement in CO2. 
  • Multi-ring basins are the largest features on Callisto's surface, resulting from concentric fracturing of the lithosphere lying on top of a softer layer (possibly an ocean).  Valhalla is a multi-ring impact structure 3800 km in diameter. Asgard is the second largest. These enormous features are named after the homes of the gods in Norse mythology.


Friday, 17 January 2014

What Gives Jupiter its Colourful Stripes?

Despite four decades of planetary explorers reaching across the solar system to Jupiter, we still don't have the answer to a very basic question - why is Jupiter's Great Red Spot.... red?  And that's not the only conundrum - Jupiter's stripes, storms, vortices and waves can take on a bewildering range of colourful hues, from dusky white to yellows and ruddy browns, and even hints of green and blue tints if you look at the right moments.  And yet the atmospheric chemistry responsible for the jovian rainbow has remained elusive.  This post was inspired by interactions with the BBC research team for some of their upcoming science shows.

What are the clouds made of?
The colourful clouds of Jupiter seen by Cassini
(Credit NASA/JPL/University of Arizona)


When you look at Jupiter through a telescope, you're seeing photons of light being reflected back from the cloud tops in Jupiter's atmosphere, at pressure levels not dissimilar to the atmospheric pressure at the Earth's surface.  These clouds reside in the atmospheric region known as the troposphere, the location of the swirling, churning weather activity we're all familiar with.  Unlike on Earth, where water condenses and/or freezes to form the white clouds in our atmosphere, theory suggests that the ice clouds on the giant planets should be layered.  Ammonia condenses to ammonia ice at the coldest temperatures, so form the uppermost cloud decks.   That means that the bulk of the gaseous ammonia is locked away in a reservoir beneath the clouds.  Above the clouds, there's only a little ammonia left to interact with UV light to form photochemical hazes.

Moving deeper into the planet, the ammonia can react with hydrogen sulphide to form a cloud of NH4SH, the next thick cloud deck.  And even deeper, water condenses to form a thick aqueous cloud layer which may be the source of much of the convective activity that we see.  It's important to note, however, that it's really hard to peer down through the topmost ammonia cloud, so all these deeper clouds are predictions based on chemistry.  We don't know, for example, exactly how much water is locked away within Jupiter, but that determines the height and extent of any water cloud that would be there [that's one of the key goals of NASA's Juno spacecraft, two years away from arrival at Jupiter].  So our understanding of what's going on beneath the clouds you can see through a telescope is really limited, and largely constrained by theory rather than direct observation.

The cloud decks of Jupiter.
Unfortunately, the picture is even murkier than that. Ammonia ice has a well-understood spectral fingerprint, with features that we could potentially identify in spectra of Jupiter's reflected light.  Try as we might, we only ever see these signatures in small regions of the planet.  Working with Galileo spacecraft observations in the near-infrared (NIMS), ammonia clouds were only detected in very localised regions associated with powerful convective dynamics covering less than 1% of the planet, almost like the ammonia ice could only be detected when it was fresh (i.e., newly transported up to the cloud decks from below).  The most prominent signature was found in turbulent wake to the northwest of the Great Red Spot.  Generally speaking, the Galileo observations (in tandem with ground-based studies) showed that these pure, fresh ammonia ice signatures were absent across much of the planet.  In essence, although we suspect that we're seeing clouds of ammonia, we cannot confirm it using data from cutting-edge spacecraft.

In the past five years attention has focussed on anomalous spectral features near 3 microns, observed by both the Infrared Space Observatory (ISO) in the 1990s and the Cassini near-infrared instrument (VIMS) on its 2000/2001 flyby of Jupiter.  This signature seems to be present everywhere, from light zones to dark belts, but the actual cloud composition responsible for the signature is unclear - maybe it is a combination of the ammonia and NH4SH clouds, with one species coating a seed of the other one, masking the signatures we'd expect.  It certainly wasn't the signature of pure ammonia ice.  Possible water ice signatures were even harder to identify, but were tentatively seen in Voyager data.  To summarise - those top clouds certainly have nitrogen-based species in them, but how much, and how it's mixed/coated with other species, remains unclear.

But what about the colours?

The basic problem in all this is that ammonia ice is white (and water ice, for that matter).  Nice, clean, white.  So if that's not the source of the array of colours we see, there must be something else.  Focussing specifically on the red colourants, we're looking for some cloud or haze that absorbs all the blue light from the Sun, and therefore only reflects back the red.  The only thing we know for sure is that it has to be a blue-light absorber that's present in some places (reddish belts and giant vortices) but absent elsewhere (white belts and whitish small ovals).  What might it be?

Here's the crux of the matter - there are lots of candidates that could fit this bill.  The most likely explanation lies in the 'haze' above the main cloud decks.  If we define clouds as those volatile gas species that condense, then the haze is the thinner, more ubiquitous aerosol particles that sits over the top of the main nitrogen-based clouds.  Light being reflected from Jupiter's clouds is being filtered by that haze, so maybe the blue-light absorber is present there.   There are lots of ideas, but observations don't help distinguish between things.  Maybe material dredged upwards from the deeper troposphere by powerful convective updrafts then reddens in the presence of UV light, which might work for phosphorus (e.g., red triclinic phosphorus, P4) or sulphur based species.  Or photochemical reactions of ammonia and phosphine could form hydrazine or diphosphene, respectively, whose spectral properties are poorly understood but could be key compounds in the hazes. Or some sort of poorly-understood ultraviolet tanning of aerosols that hang around for a long period of time.  Maybe the products of methane-based photochemistry in the stratosphere could be raining down into the troposphere like a smog, coating the seed aerosols that are already there.  In that case, we'd be seeing long-chain hydrocarbons, polymers, maybe an organic sludge known as tholins.  It's really tough to rule any of these out with the data we have today.

So how do we solve the problem?


Comparing cloud colours from Hubble with
atmospheric temperatures from VLT (Fletcher et al., 2010)
Well, perhaps the only way to do this properly would be to have multiple Jupiter entry probes falling into regions of different colours and designed to sniff out the chemical and optical properties of the clouds and hazes.  We've already done this once with the Galileo probe, but we suspect that this entered a region of unusual meteorology called a hotspot that dried out the atmosphere of all its clouds.  The probe was often referred to as having entered the 'sahara desert' of Jupiter.  Failing that, we must continue the search using laboratory work (i.e., synthesising suitable jovian clouds in the lab and seeing what influences their colours) and theory (i.e., developing an accurate model of jovian chemistry).  Recent lab work has shown some promise - Carlson et al. presented results at a 2012 conference showing how tropospheric ammonia and stratospheric acetylene might be mixed together, photolysed and react to form a yellow-orange film and potentially nitriles like hydrogen cyanide (HCN) as a by-product, giving us an indirect way of studying the colouration problem.  Jupiter's episodic colour changes, such as the 2009-2012 global upheaval of the cloud structure or the recent reddening of a northern-hemisphere oval, provides a useful way of relating colour changes to alterations in environmental conditions (temperatures, humidity, opacity) that we hope will provide additional insights.

In summary, we still don't know why Jupiter's red spot is red.  And for planetary scientists, that's a little embarrassing.  But we have plenty of ideas to try, theories to test and discount.  Ultimately a combination of lab work, theory and observations will help solve this mystery once and for all.